by Don Vialoux, EquityClock.com
The Bottom Line
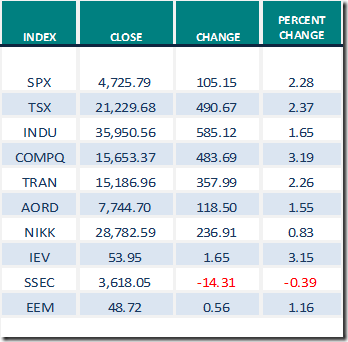
Santa Claus comes to Bay Street and Wall Street. The S&P 500 Index closed at an all-time closing high at 4,725.79, just short of its all-time inter-day high at 4743.83. Historically, the Santa Claus rally has extended to the end of the first week in January.
Observations
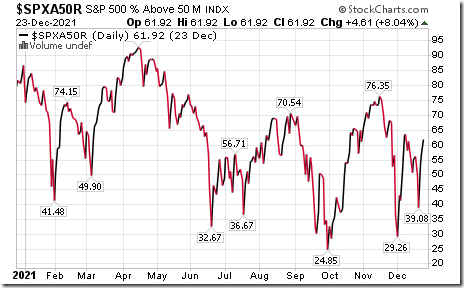
Intermediate term technical indicator for U.S. equity markets (Percent of S&P 500 stocks trading above their 50 day moving average) moved higher last week. It returned from Neutral to Overbought. Trend is up. See Momentum Barometer chart at the end of this report.
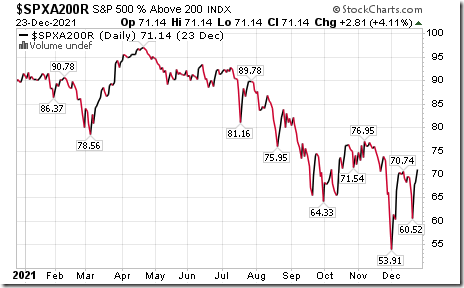
Long term technical indicator for U.S. equity markets (Percent of S&P 500 stocks trading above their 200 day moving average) moved higher last week. It remained Overbought. Trend is up. See Momentum Barometer chart at the end of this report.
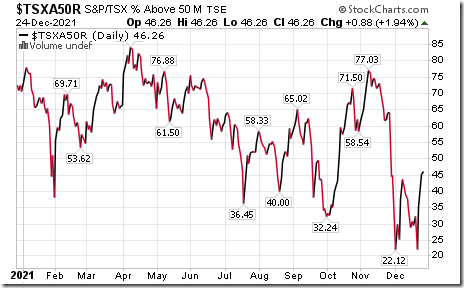
Intermediate term technical indicator for Canadian equity markets changed last week from Oversold to Neutral on a recovery above 40.00. See Momentum Barometer chart at the end of this report.
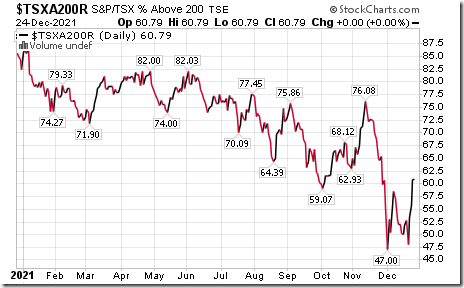
Long term technical indicator for Canadian equity markets (Percent of TSX stocks trading above their 200 day moving average) moved higher last week. It changed from Neutral to Overbought on a move above 60.00. See Momentum Barometer chart at the end of this report.
Economic News This Week
November U.S. Trade Balance to be released at 8:30 AM EST on Wednesday is expected to be a deficit of versus a deficit of $83.20 billion in October.
December Chicago Purchasing Managers Index to be released at 9:45 AM EST on Thursday is expected to slip to 61.5 from 61.8 in November.
Selected Earnings News This Week
Nil
Trader’s Corner
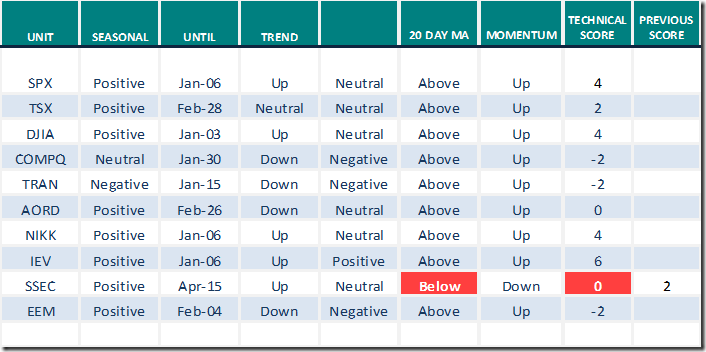
Equity Indices and Related ETFs
Daily Seasonal/Technical Equity Trends for Dec.24th 2021
Green: Increase from previous day
Red: Decrease from previous day
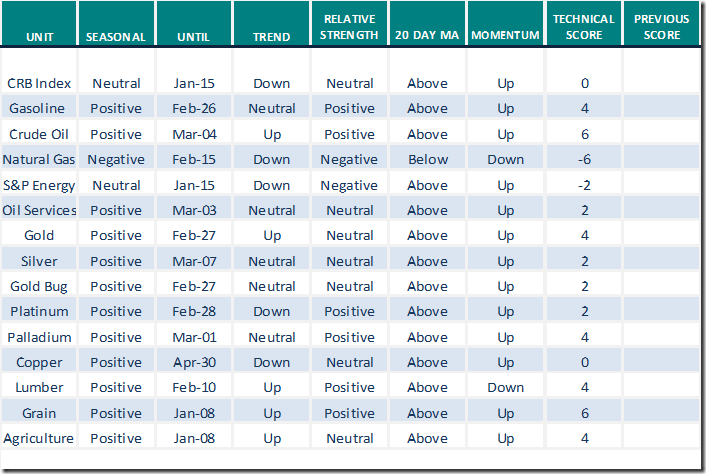
Commodities
Daily Seasonal/Technical Commodities Trends for Dec.24th 2021
Green: Increase from previous day
Red: Decrease from previous day
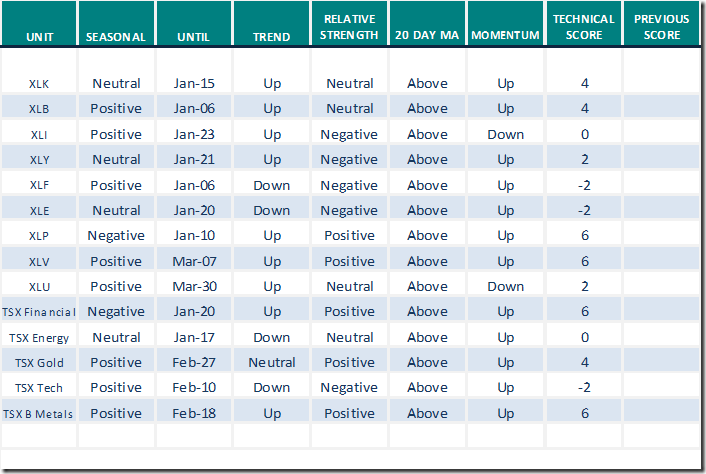
Sectors
Daily Seasonal/Technical Sector Trends for Dec.24th 2021
Green: Increase from previous day
Red: Decrease from previous day
All seasonality ratings are based on performance relative to the S&P 500 Index (except TSX).
Links offered by valued providers
Mark Leibovit’s weekly comment on HoweSteet.com notes that “the first week in January frequently sets the trend for the following year”. Following is a link:
https://www.howestreet.com/2021/12/2022-first-week-could-set-market-trend-for-year-mark-leibovit/
Greg Schnell asks “Does the sun shine in December”? Following is the link:
Does the Sun Shine in December? | ChartWatchers | StockCharts.com
Tom Bowley from StockCharts says “Sorry, But I don’t believe in this Santa Claus rally”. Following is a link:
Sorry, But I Don’t Believe in This Santa Claus Rally | ChartWatchers |
StockCharts.com
Technical Scores
Calculated as follows:
Intermediate Uptrend based on at least 20 trading days: Score 2
(Higher highs and higher lows)
Intermediate Neutral trend: Score 0
(Not up or down)
Intermediate Downtrend: Score -2
(Lower highs and lower lows)
Outperformance relative to the S&P 500 Index: Score: 2
Neutral Performance relative to the S&P 500 Index: 0
Underperformance relative to the S&P 500 Index: Score –2
Above 20 day moving average: Score 1
At 20 day moving average: Score: 0
Below 20 day moving average: –1
Up trending momentum indicators (Daily Stochastics, RSI and MACD): 1
Mixed momentum indicators: 0
Down trending momentum indicators: –1
Technical scores range from -6 to +6. Technical buy signals based on the above guidelines start when a security advances to at least 0.0, but preferably 2.0 or higher. Technical sell/short signals start when a security descends to 0, but preferably -2.0 or lower.
Long positions require maintaining a technical score of -2.0 or higher. Conversely, a short position requires maintaining a technical score of +2.0 or lower
Changes Last Week
Technical Notes released on Friday at
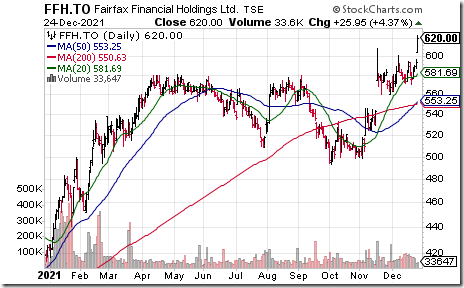
Fairfax Financial $FFH.CA moved above $609.00 extending an intermediate uptrend. The company announced a $1 billion share buyback program
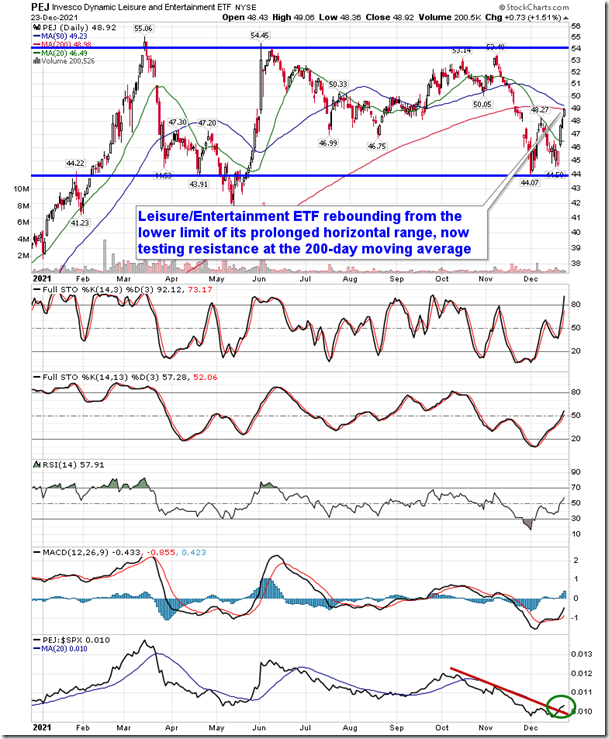
The alleviation of negative bets has pushed stocks back to all-time highs, despite COVID concerns. We have new data pertaining to driving activity and credit conditions. equityclock.com/2021/12/23/… $PEJ $JETS
Forecast to be provided exclusively to subscribers of EquityClock.com: https://charts.equityclock.com/subscribe
Events leading to this forecast include:
· A significant slowdown in year-over-year earnings growth momentum by major U.S. and Canadian companies. Strong earnings growth in the fourth quarter by S&P 500 and TSX 60 companies to be reporting in January and February are to be followed by modest growth thereafter. Fourth quarter 2021earnings by S&P 500 companies are expected to increase 21.3% while first quarter 2022 earnings are expected to increase 6.2% and second quarter earnings are expected to increase only 4.1%.
· A substantial increase in U.S. Federal government spending following recent passage of the $1.1 trillion Infrastructure bill, the largest federal government spending bill in U.S. history. Incremental spending will add to inflation pressures in the U.S. and Canada early in 2022. Possible passage of the “Build Back Better” program valued at $1.75 trillion will further aggravate inflation pressures if passed early in 2022.
· Increasing fiscal pressure to reduce economic activity temporally early in early 2022 due to rapidly growing Omicron variant infections.
· Resumption of economic recovery in the second half of 2022 when concerns about Omicron variant infections dissipate.
· Increasing monetary pressures to raise the Fed Fund rate in the second quarter after completion of tapering of FOMC purchases of U.S. government backed securities at $30 billion per month by the end of March.
· Anticipation in the second half of 2022 of a mid-term election in early November that will change control of the U.S. House of Representatives and Senate from Democrats to the more business friendly Republicans.
S&P 500 Momentum Barometers
The intermediate term Barometer added 12.02 last week to 61.92. It changed from Neutral to Overbought on a move above 60.00. Trend is up.
The long term Barometer added 5.61 to 71.14 last week. It remains Overbought. Trend is up.
TSX Momentum Barometers
The intermediate term Barometer added 0.88 on Friday and up 13.99 last week to 46.26. It changed from Oversold to Neutral on a move above 40.00. Trend is up.
The long term Barometer was unchanged on Friday and up 8.06 last week to 60.79. It changed from Neutral to Overbought on a move above 60.00. Trend is up.
Disclaimer: Seasonality and technical ratings offered in this report and at
www.equityclock.com are for information only. They should not be considered as advice to purchase or to sell mentioned securities. Data offered in this report is believed to be accurate, but is not guaranteed
This post was originally publised at Vialoux's Tech Talk.


