by Don Vialoux, EquityClock.com
The Bottom Line
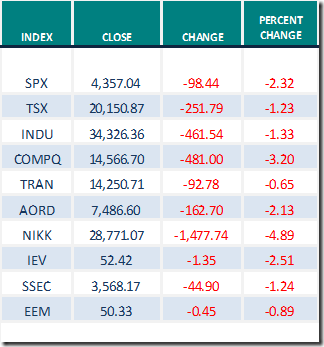
World equity indices were mostly lower again last week. Greatest influences are ramping up of a fourth wave by COVID 19 (negative) and continued expansion of distribution of a COVID 19 vaccine (positive).
Observations
Developed world equity indices were lower last week. Positive technical action on Friday by U.S. equity indices showed promise of an intermediate low. Outperformance by the Dow Jones Transportation Average and its related components was notable on Friday.
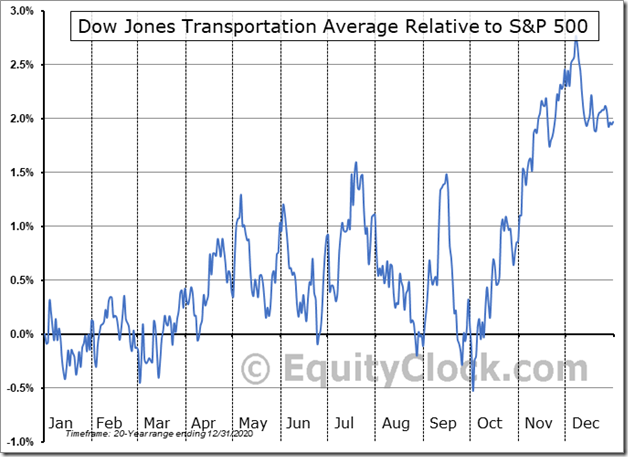
The Dow Jones Transportation Average and its related ETF: IYT have a history of reaching a seasonal low on October 1st on a real and relative basis followed by their strongest advance in the year to the second week in December. Strength relative to the S&P 500 Index turned positive two weeks ago.
Short term short term indicators for U.S. equity indices and sectors (20 day moving averages, short term momentum indicators) moved lower last week.
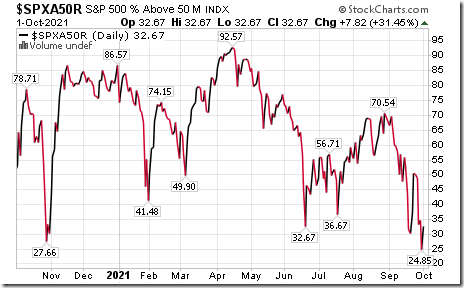
Intermediate term technical indicator for U.S. equity markets (Percent of S&P 500 stocks trading above their 50 day moving average) moved lower last week. It changed from Neutral to Oversold, but show early signs of bottoming on Friday. See Barometer chart at the end of this report.
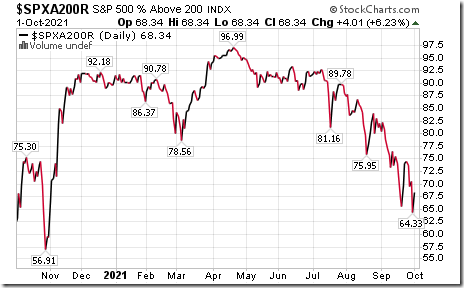
Long term technical indicator for U.S. equity markets (Percent of S&P 500 stocks trading above their 200 day moving average) moved lower last week. It remained Overbought and trending lower See Barometer chart at the end of this report.
Short term momentum indicators for Canadian indices and sectors moved lower last week.
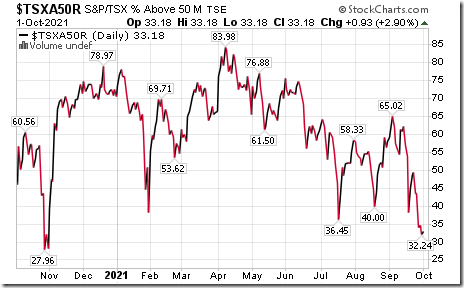
Intermediate term technical indicator for Canadian equity markets moved lower again last week. It changed from Neutral to Overbought and is trending down. See Barometer chart at the end of this report.
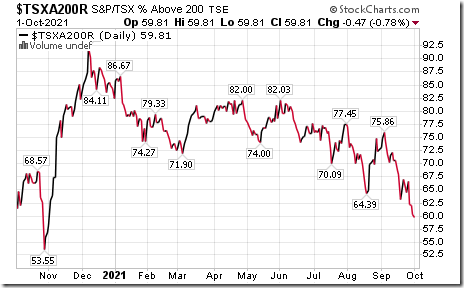
Long term technical indicator for Canadian equity markets (Percent of TSX stocks trading above their 200 day moving average) moved lower last week. It changed from Overbought to Neutral. See Barometer charts at the end of this report.
Consensus estimates for earnings and revenues in 2021 by S&P 500 companies were virtually unchanged again last week. According to www.FactSet.com Earnings in the third quarter are projected to increase 27.6% and revenues are projected to increase 14.9%.. Earnings in the fourth quarter are projected to increase 21.5% and revenues are projected to increase 11.4% (versus 11.3% last week). Earnings for all of 2021 are projected to increase 42.6% and revenues are projected to increase 15.0% (versus 14.9% last week).
Earnings and revenue growth continues in 2022, but at a slower pace. .Consensus earnings in 2022 by S&P 500 companies are projected to increase 9.6% (versus 9.5% last week) and revenues are projected to increase 6.7%. Consensus earnings for the first quarter are projected to increase 5.3% on a year-over-year basis (versus 5.5% last week) and revenues are expected to increase 8.3% (versus 8.2% last week).
Economic News This Week
August Factory Orders to be released at 10:00 AM EDT on Monday are expected to increase 1.0% versus a gain of 0.4% in July.
Canadian August Trade Balance to be released at 8:30 AM EDT on Tuesday is expected to be a surplus of $0.35billion versus $0.78 billion in July.
U.S. August Trade Deficit to be released at 8:30 AM EDT on Tuesday is expected to increase to $70.50 billion from $70.10 billion in July
September Non-Manufacturing ISM PMI to be released at 10:00 AM EDT on Tuesday is expected to slip to 60.0 from 61.7 in August.
September ADP Employment Report to be released at 8:15 AM EDT on Wednesday is expected to increase to 430,000 from 374,000 in August.
September Non-farm Payrolls to be released at 8:30 AM EDT on Friday are expected to increase to 460,000 from 235,000 in August. September Unemployment Rate is expected to slip to 5.1% from 5.2%. September Average Hourly Earnings are expected to increase 0.4% versus a gain of 0.6% in August.
September Canadian Employment to be released at 8:30 AM EDT on Friday is expected to gain 60,000 versus a gain of 90,200 in August. September Canadian Unemployment Rate is expected to decrease to 6.9% from 7.1% in August.
Selected Earnings Reports This Week
Four S&P 500 companies are scheduled to report quarterly results this week.
Tuesday: Pepsico
Wednesday: Constellation Brands
Thursday: ConAgra
Trader’s Corner
Equity Indices and Related ETFs
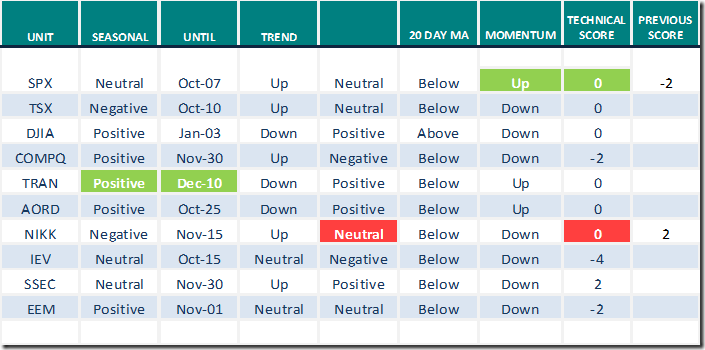
Daily Seasonal/Technical Equity Trends for Oct.1 2021
Green: Increase from previous day
Red: Decrease from previous day
Commodities
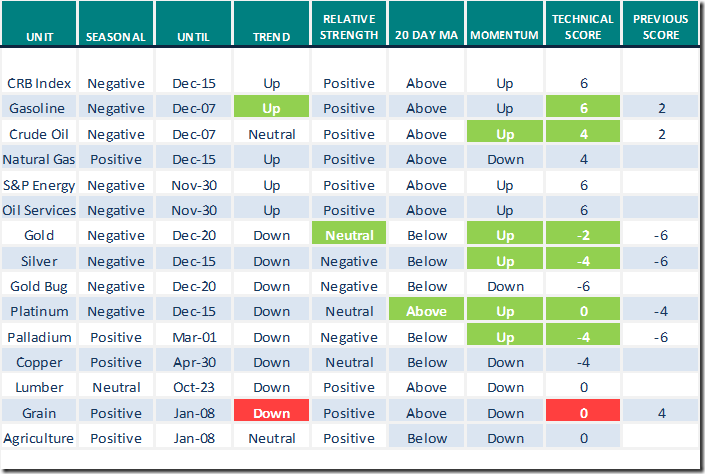
Daily Seasonal/Technical Commodities Trends for Oct.1 2021
Green: Increase from previous day
Red: Decrease from previous day
Sectors
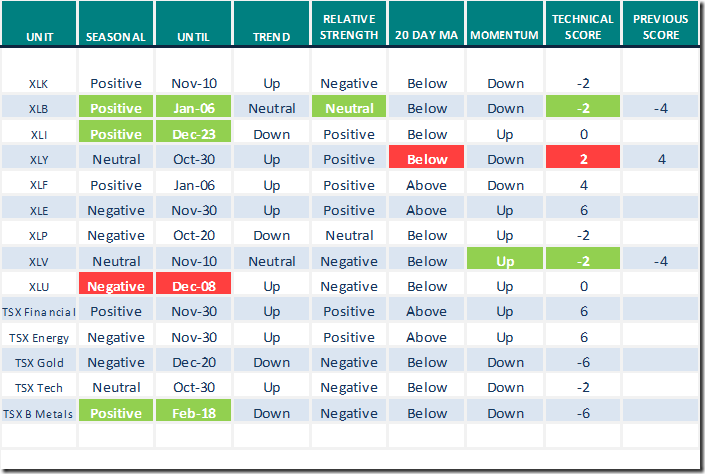
Daily Seasonal/Technical Sector Trends for Oct.1 2021
Green: Increase from previous day
Red: Decrease from previous day
All seasonality ratings are based on performance relative to the S&P 500 Index
Technical Scores
Calculated as follows:
Intermediate Uptrend based on at least 20 trading days: Score 2
(Higher highs and higher lows)
Intermediate Neutral trend: Score 0
(Not up or down)
Intermediate Downtrend: Score -2
(Lower highs and lower lows)
Outperformance relative to the S&P 500 Index: Score: 2
Neutral Performance relative to the S&P 500 Index: 0
Underperformance relative to the S&P 500 Index: Score –2
Above 20 day moving average: Score 1
At 20 day moving average: Score: 0
Below 20 day moving average: –1
Up trending momentum indicators (Daily Stochastics, RSI and MACD): 1
Mixed momentum indicators: 0
Down trending momentum indicators: –1
Technical scores range from -6 to +6. Technical buy signals based on the above guidelines start when a security advances to at least 0.0, but preferably 2.0 or higher. Technical sell/short signals start when a security descends to 0, but preferably -2.0 or lower.
Long positions require maintaining a technical score of -2.0 or higher. Conversely, a short position requires maintaining a technical score of +2.0 or lower
Changes Last Week
StockTwits released on Thursday and Friday
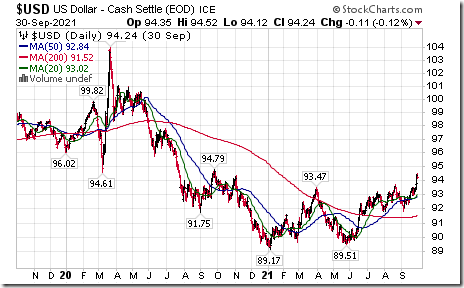
Breakout by the U.S. Dollar Index and its related ETF $UUP above a double bottom pattern is receiving lots of technical chatter.
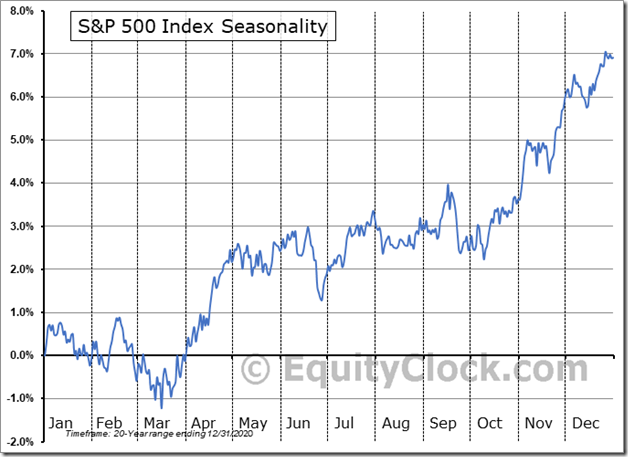
The S&P 500 Index has averaged a gain of 1.1% in the month of October as it rebounds from the weakest, most volatile month of the year. equityclock.com/2021/09/30/… $SPX $SPY $ES_F $STUDY
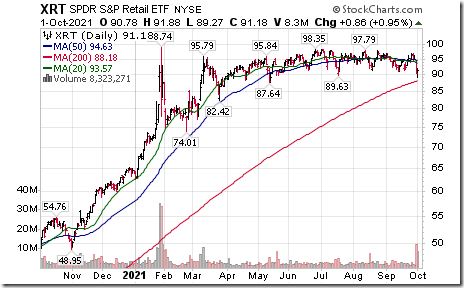
Retail SPDRs $XRT moved below $89.63 completing a double top pattern.
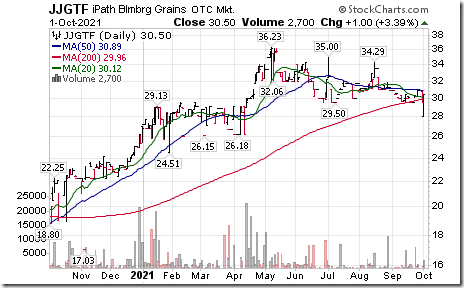
Grain ETN $JJGTF with an equal weight in corn, soybeans and wheat moved below $24.50 completing a double top pattern.
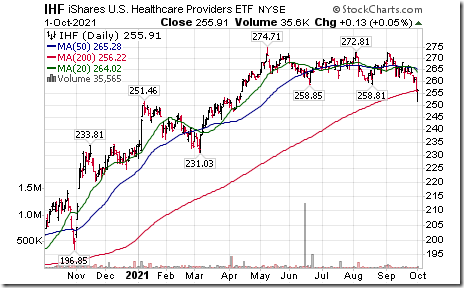
Healthcare Providers iShares $IHF moved below $258.85 and $258.81 completing a Head & Shoulders pattern.
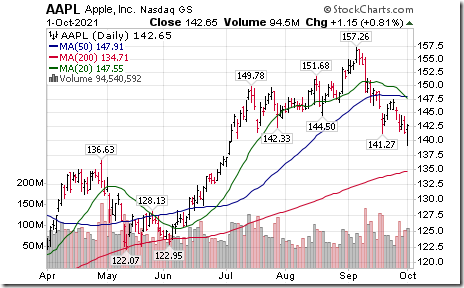
Apple $AAPL moved below $141.46 and $141.27 completing a short term Head & Shoulders pattern.
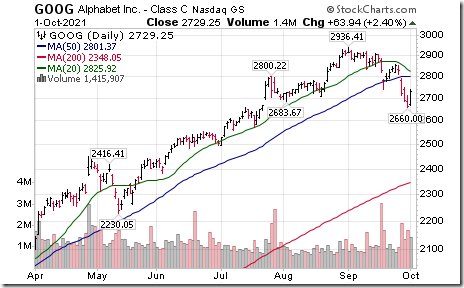
Alphabet $GOOG a NASDAQ 100 stock moved below intermediate support at $2,683.67
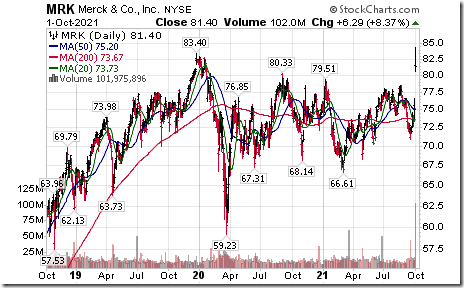
Merck $MRK a Dow Jones Industrial Average stock moved above $78.53, $79.51 and $83.40 to an all-time high after announcing a pill version of the COVID 19 vaccine. Producers of the regular vaccine moved lower. Moderna $MRNA and Johnson & Johnson $JNJ broke support setting an intermediate downtrend.
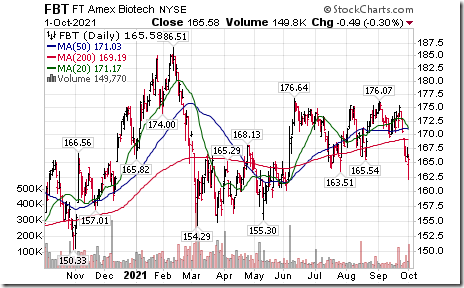
Biotech ETF $FBT moved below $163.51 completing a double top pattern.
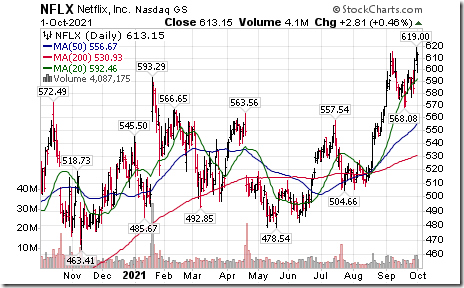
Netflix $NFLX a NASDAQ 100 stock moved above $615.60 to an all-time high extending an intermediate uptrend.
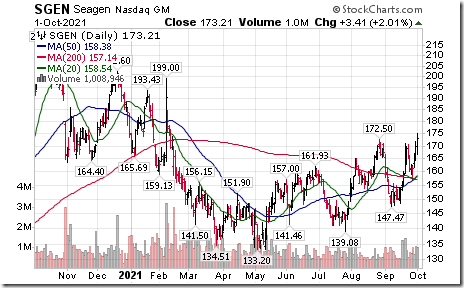
Seagen $SGEN a NASDAQ 100 stock moved above $172.50 extending an intermediate uptrend.
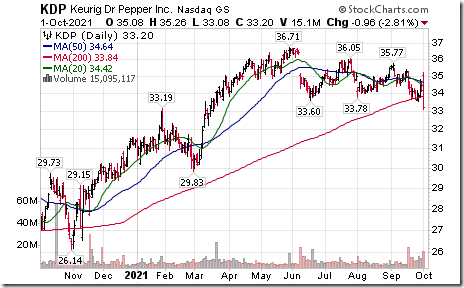
Keurig Dr. Peppe $KDP a NASDAQ 100 stock moved below $33.60 completing a double top pattern.
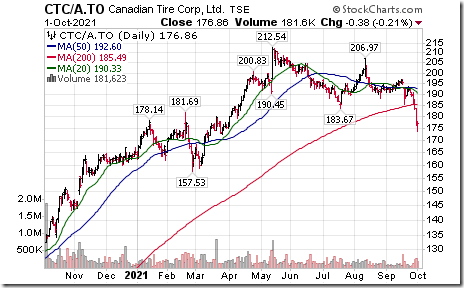
Canadian Tire $CTC.A.CA a TSX 60 stock moved below $183.67 completing a double top pattern.
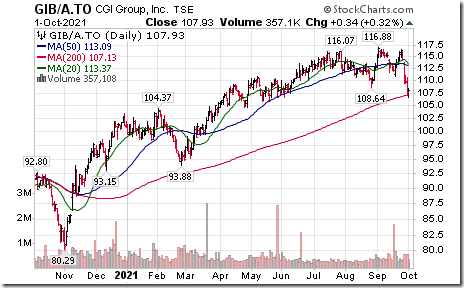
CGI Group $GIB.A.CA and $GIB a TSX 60 stock moved below Cdn$108.64 and US$86.00 completing double top patterns.
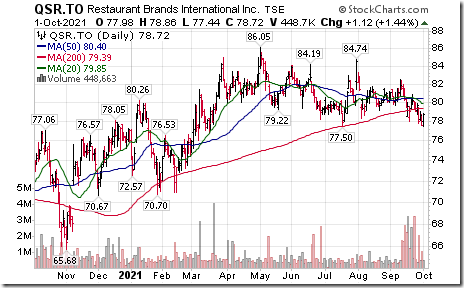
Restaurant Brands International $QSR.CA a TSX 60 day moved below Cdn$77.50 completing a double top pattern.
Links from valued providers
Greg Schell comments on “Sights from the Railway”
Sights From The Railway | The Canadian Technician | StockCharts.com
Arthur Hill comments on the Agriculture sector just as it enters its period of seasonal strength
Thank you to David Chapman and www.EnrichedInvesting.com for a link to the following weekly Technical Scoop report:
Michael Campbell’s Money Talks for October 2nd: Includes an interview with Martin Armstrong.
Aaaand… We’re On! Entire Show – October 2nd (mikesmoneytalks.ca)
Thank you to Mark Bunting and www.uncommonsenseinvestor.com for links to the following comments and videos:
Five Top-Rated Stocks Chosen by an AI Program – Uncommon Sense Investor
How to Build a Portfolio – Uncommon Sense Investor
How to Mix Stocks with Tactical ETFs & Why Bonds Are An "Awful" Investment – Uncommon Sense Investor
How to Zig When the Market Zags to Get Downside Protection – Uncommon Sense Investor
Posthaste: Why the TSX is poised for an ‘epic dividend growth’ cycle | Financial Post
S&P 500 Momentum Barometers
The intermediate term Barometer recovered 7.82 on Friday after reaching a low of 24.85 on Thursday, but dropped 17.43 last week to 32.67. It changed from Neutral to Oversold on a move below 40.00 and showed possibility of a low on Friday for this cycle.
The long term Barometer added 4.01 to 68.34 on Friday, but dropped 6.21 last week to 68.34. It remained Overbought and trending down.
TSX Momentum Barometers
The intermediate term Barometer added 0.93 on Friday, but dropped 10.42 last week to 33.18. It changed from Neutral to Overbought on a move below 40.00 and is trending down. Significant signs of a low have yet to appear.
The long term Barometer slipped 0.47 on Friday and 4.65 last week to 59.81. It changed from Overbought to Neutral on Friday on a move below 60.00. Trend remains down.
Disclaimer: Seasonality and technical ratings offered in this report and at
www.equityclock.com are for information only. They should not be considered as advice to purchase or to sell mentioned securities. Data offered in this report is believed to be accurate, but is not guaranteed
This post was originally publised at Vialoux's Tech Talk.


