by Don Vialoux, EquityClock.com
The Bottom Line
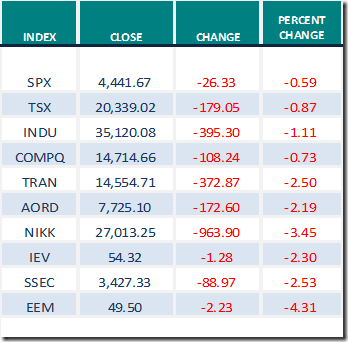
Developed world equity indices were lower last week. Greatest influences remain ramping up of a fourth wave by COVID 19 (negative) and continued expansion of distribution of a COVID 19 vaccine (positive).
Observations
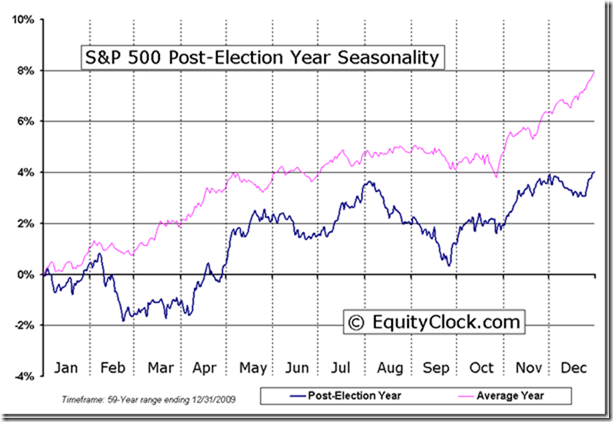
Unfavourable seasonal influences for equity markets from the beginning of August to the end of September (particularly in a Post-U.S. Presidential Election year) began to appear last week. “Selling on news” was triggered despite strong second quarter results released by the remainder of reporting Canadian and U.S. companies. Growing COVID 19 concerns overwhelmed good corporate news. North American equity markets have a history of recording a mild correction of 3%-4% between now and the end of September followed by resumption of an intermediate uptrend to the end of the year.
Short term short term indicators for U.S. equity indices and sectors (20 day moving averages, short term momentum indicators) moved lower last week.
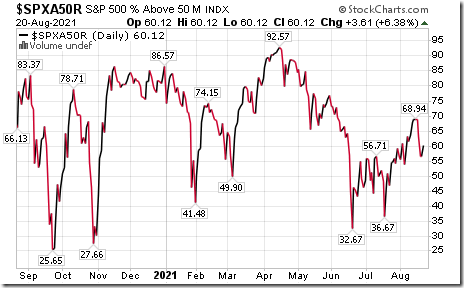
Intermediate term technical indicator for U.S. equity markets (Percent of S&P 500 stocks trading above their 50 day moving average) moved lower last week. It remained Overbought and trending down. See Barometer charts at the end of this report.
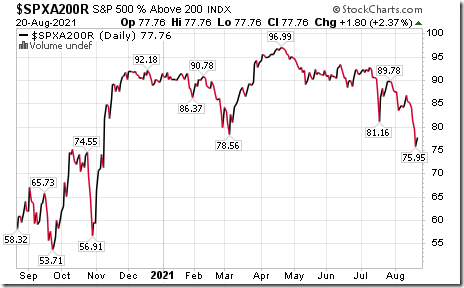
Long term technical indicator for U.S. equity markets (Percent of S&P 500 stocks trading above their 200 day moving average) moved lower again last week. It changed from Extremely Overbought to Overbought on a move below 80.00. See Barometer chart at the end of this report.
Short term momentum indicators for Canadian indices and sectors were lower last week.
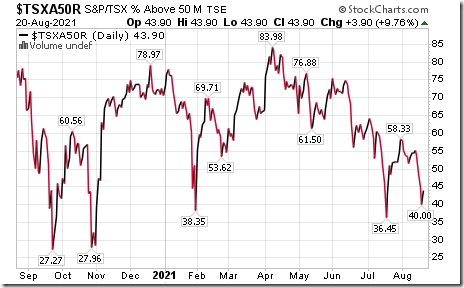
Intermediate term technical indicator for Canadian equity markets moved lower again last week. It remained Neutral. See Barometer chart at the end of this report.
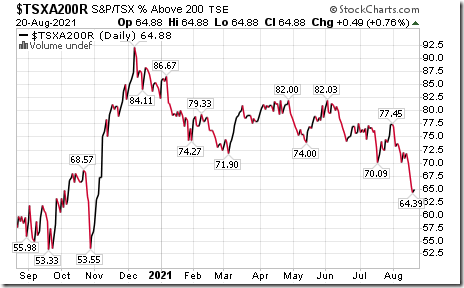
Long term technical indicator for Canadian equity markets (Percent of TSX stocks trading above their 200 day moving average) moved lower again last week. It remained Overbought. See Barometer charts at the end of this report.
Economic News This Week
July U.S. Existing Home Sales to be released at 10:00 AM EDT on Monday are expected to slip to 5.83 million units from 5.86 million units in June.
July U.S. New Home Sales to be released at 10:00 AM EDT on Tuesday are expected to increase to 700,000 from 676,000 in June.
July Durable Goods Orders to be released at 8:30 AM EDT on Wednesday are expected to drop 0.2% versus a gain of 0.9% in June. Excluding aircraft orders, July Durable Goods Orders are expected to increase 0.5% versus a gain of 0.5% in June.
Jackson Hole Symposium with a focus on U.S. monetary policy is held on Wednesday
Second quarter U.S. real GDP to be released at 8:30 AM EDT on Thursday is expected to grow at a 6.6% annual rate versus growth at a 6.5% rate in the second quarter.
July Personal Income to be released at 8:30 AM EDT on Friday is expected to increase 0.2% versus a gain of 0.1% in June. July Personal Spending is expected to increase 0.3% versus a gain of 0.5% in June.
August Consumer Sentiment to be released at 10:00 AM EDT on Friday is expected to increase to 70.9 from 70.2 in July.
Selected Earnings News This Week
Focus is on reports by Canada’s banks
Trader’s Corner
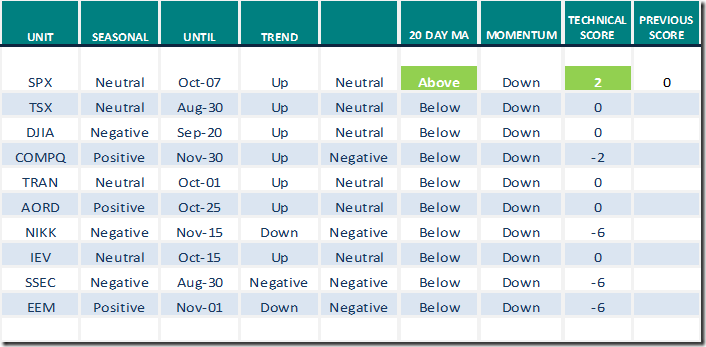
Equity Indices and Related ETFs
Daily Seasonal/Technical Equity Trends for August 20th 2021
Green: Increase from previous day
Red: Decrease from previous day
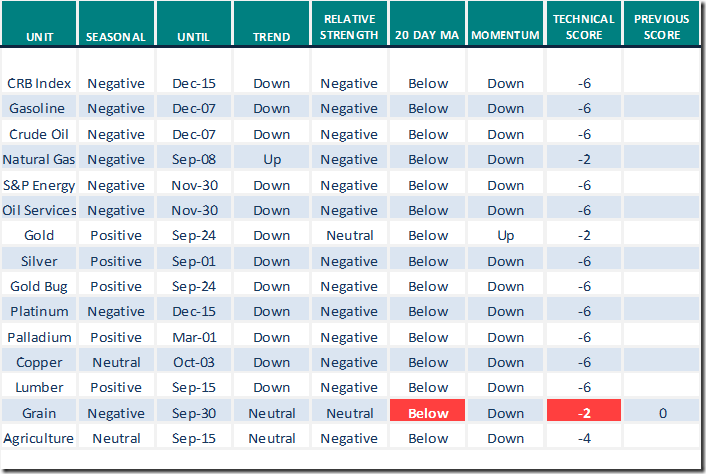
Commodities
Daily Seasonal/Technical Commodities Trends for August 20th 2021
Green: Increase from previous day
Red: Decrease from previous day
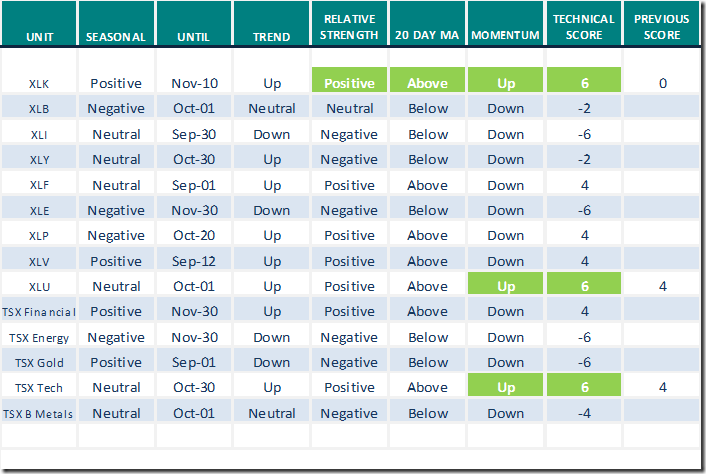
Sectors
Daily Seasonal/Technical Sector Trends for August 20th 2021
Green: Increase from previous day
Red: Decrease from previous day
All seasonality ratings are based on performance relative to the S&P 500 Index
The REAL reason traders lose money
Following is a link:
Some Winners are starting to lose
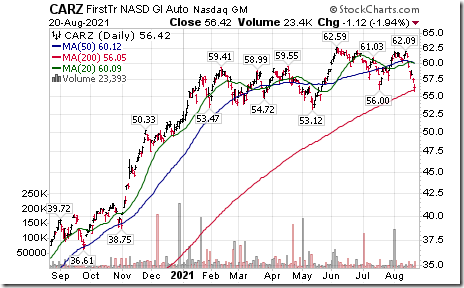
Link to comments on the auto sector by the Canadian Technician, Greg Schnell
Some Winners Are Starting To Lose | The Canadian Technician | StockCharts.com
Technical Scores
Calculated as follows:
Intermediate Uptrend based on at least 20 trading days: Score 2
(Higher highs and higher lows)
Intermediate Neutral trend: Score 0
(Not up or down)
Intermediate Downtrend: Score -2
(Lower highs and lower lows)
Outperformance relative to the S&P 500 Index: Score: 2
Neutral Performance relative to the S&P 500 Index: 0
Underperformance relative to the S&P 500 Index: Score –2
Above 20 day moving average: Score 1
At 20 day moving average: Score: 0
Below 20 day moving average: –1
Up trending momentum indicators (Daily Stochastics, RSI and MACD): 1
Mixed momentum indicators: 0
Down trending momentum indicators: –1
Technical scores range from -6 to +6. Technical buy signals based on the above guidelines start when a security advances to at least 0.0, but preferably 2.0 or higher. Technical sell/short signals start when a security descends to 0, but preferably -2.0 or lower.
Long positions require maintaining a technical score of -2.0 or higher. Conversely, a short position requires maintaining a technical score of +2.0 or lower
Changes Last Week
Notes from www.uncommonsenseinvestor.com
Thank you to Mark Bunting and uncommon SENSE Investor for links to the following items:
Ten biggest market risks right now
10 Biggest Market Risks Right Now – Uncommon Sense Investor
Definite proof this bubble is ready to burst
Chief Market Strategist: Definite Proof This Bubble is Ready to Burst – Uncommon Sense Investor
Mike’s Money Talks
Following is a link to Mike Campbell’s final show on Corus radio CKNW
https://mikesmoneytalks.ca/entire-show-aug-21st/
Technical Notes for Friday at
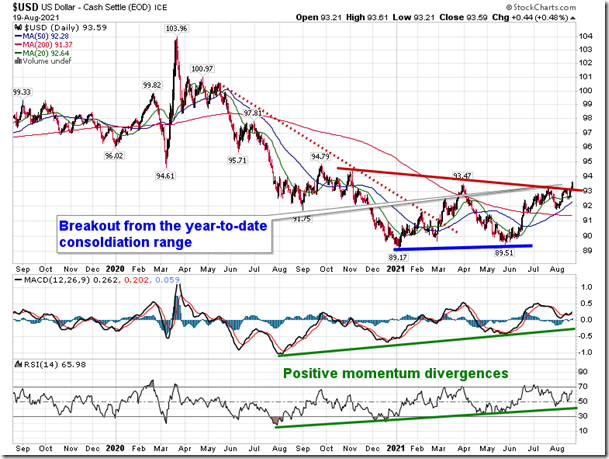
The breakout in the US Dollar Index above a double-bottom pattern is seen threatening risk assets. equityclock.com/2021/08/19/… $USDX $UUP
Auto ETF $CARZ moved below $56.00 completing a double top pattern.
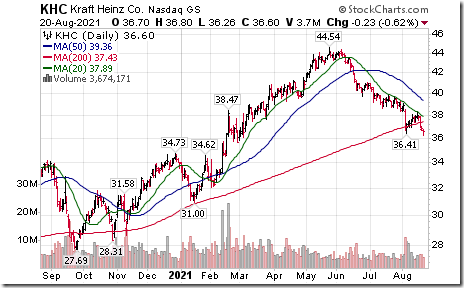
Kraft Heinz $KHC an S&P 100 stock moved below $36.41 extending an intermediate downtrend.
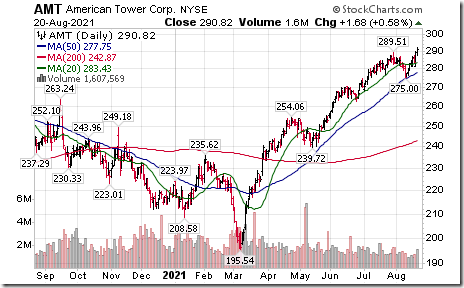
American Tower $AMT an S&P 100 stock moved above $289.51 to an all-time high extending an intermediate uptrend.
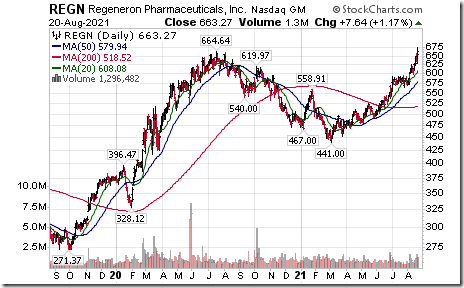
Regeneron $REGN a NASDAQ 100 stock moved above $664.64 to an all-time high extending an intermediate uptrend.
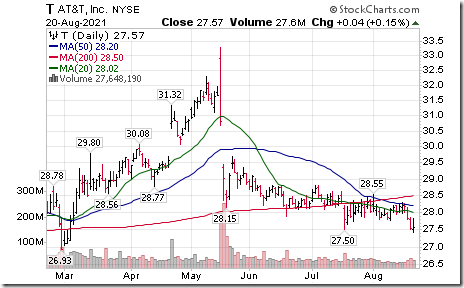
AT&T $T an S&P 100 stock moved below $27.50 extending an intermediate downtrend.
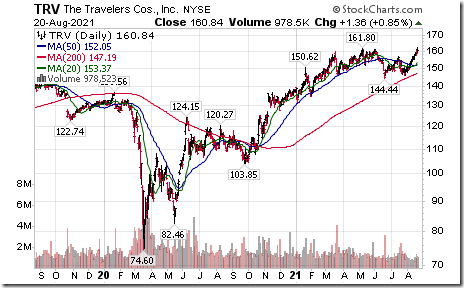
Travelers $TRV a Dow Jones Industrial Average stock moved above $161.80 to an all-time high extending an intermediate uptrend.
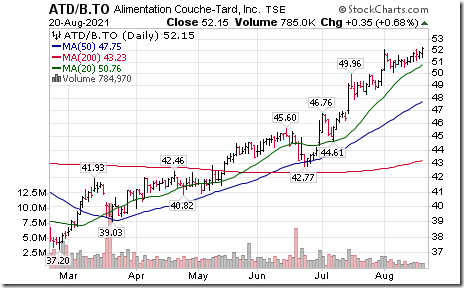
Couche Tard $ATD.B.CA a TSX 60 stock moved above $52.07 to an all-time high extending an intermediate uptrend.
S&P 500 Momentum Barometers
The intermediate term Barometer added 3.61 on Friday, but fell 8.82 last week to 60.12. It remains Overbought and trending down.
The long term Barometer added 1.80 on Friday, but dropped 7.61 last week to 77.76. It changed from Extremely Overbought to Overbought on a move below 80.00.
TSX Momentum Barometers
The intermediate term Barometer added 3.90 on Friday, but dropped 11.44 last week to 43.90. It remains Neutral and trending down.
The long term Barometer added 0.49 on Friday but fell 6.96 last week to 64.88. It remains Overbought and trending down.
Disclaimer: Seasonality and technical ratings offered in this report and at
www.equityclock.com are for information only. They should not be considered as advice to purchase or to sell mentioned securities. Data offered in this report is believed to be accurate, but is not guaranteed
This post was originally publised at Vialoux's Tech Talk.


