
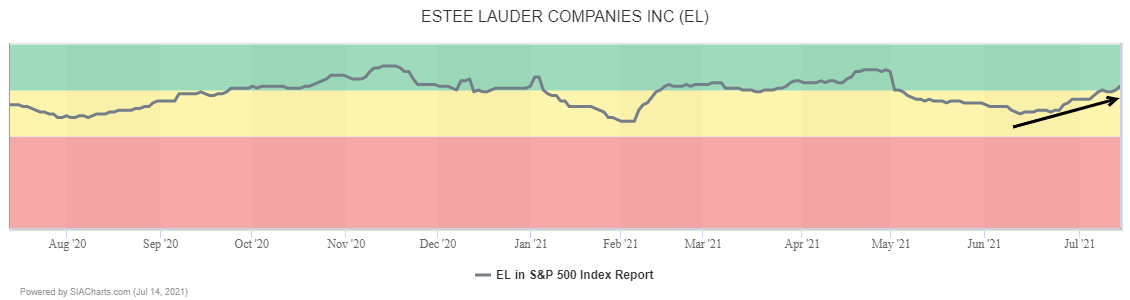
Cosmetics producer Estee Lauder (EL) has returned to the Green Favored Zone in the SIA S&P 500 Index Report from a short dip down into the yellow zone.
A major breakout is underway in Estee Lauder (EL) shares. For over a year, the shares have been trending upward in a step pattern of rallies followed by periods of consolidation at higher levels. Consistently higher lows indicate steady accumulation and consistent investor support.
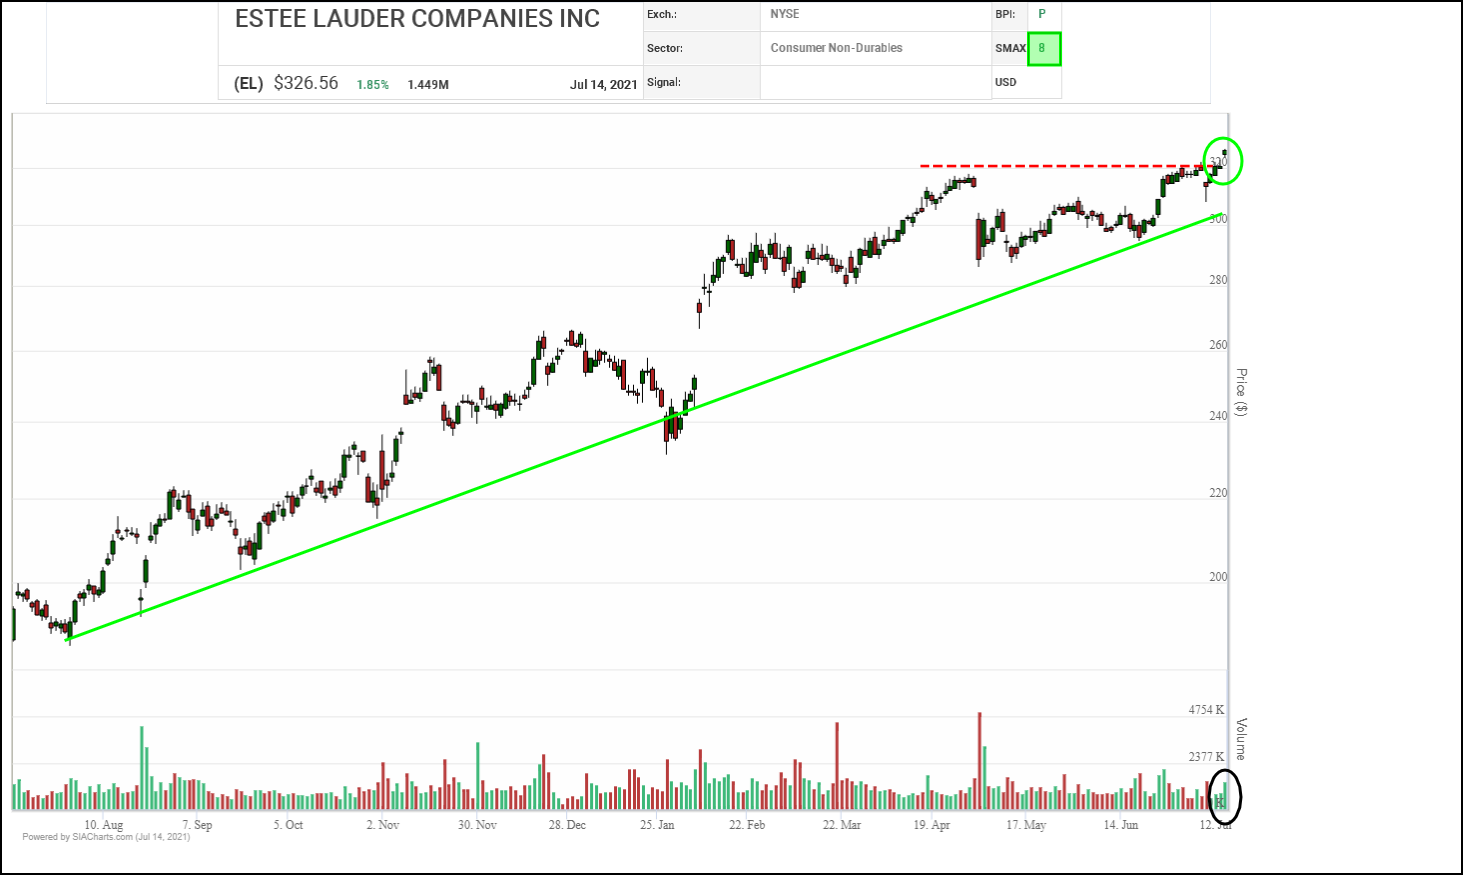
Recently, the shares had been trading in the $286 to $316 range in a normal consolidation phase. Yesterday, the shares gapped up through $320 to a new all-time high on an increase in volumes, signaling the start of a new rally phase.
Based on a measured move from the recent channel, next potential upside resistance tests appear near $346 and then $376 on trend. Initial support appears near the $316 breakout point, then the $300 round number.
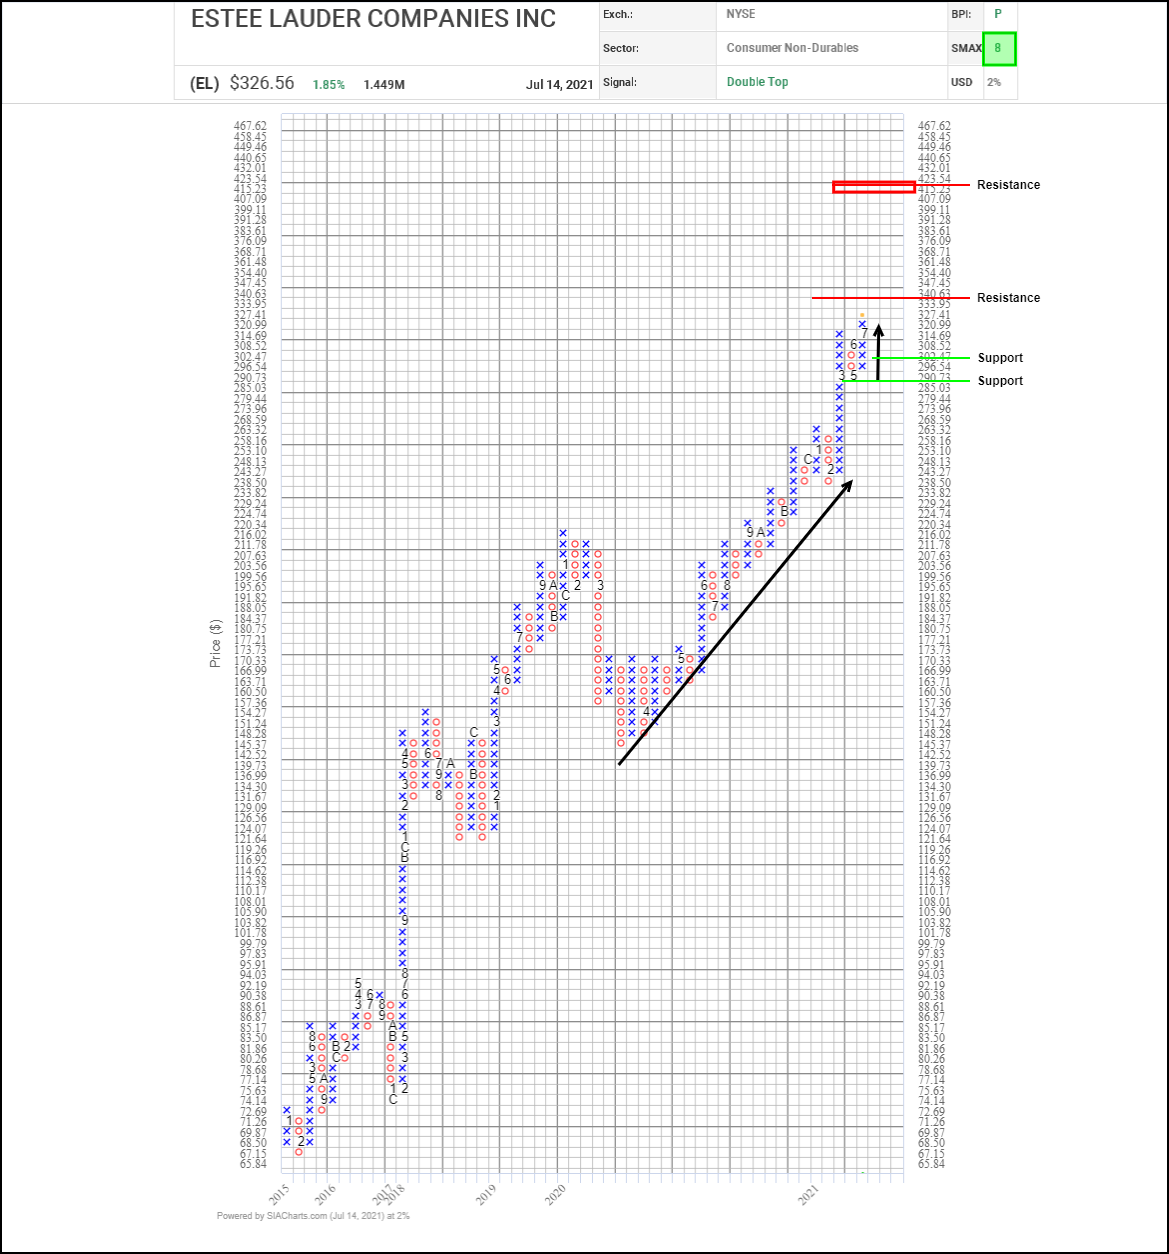
Continuing an upward trend which started with a bullish quadruple top breakout back in May of 2020, and building on last winter’s bullish high pole advance, Estee Lauder (EL) shares have broken out to a new all-time high, completing a bullish Double Top pattern and signaling the start of a new upleg.
Horizontal and vertical counts suggest potential upside resistance near $340.65, followed by the $400.00 round number and then the $412.25 to $423.55 area. Initial support appears near $296.55 based on a 3-box reversal.
With a bullish SMAX score of 8, EL is exhibiting strength against the asset classes.
Disclaimer: SIACharts Inc. specifically represents that it does not give investment advice or advocate the purchase or sale of any security or investment whatsoever. This information has been prepared without regard to any particular investors investment objectives, financial situation, and needs. None of the information contained in this document constitutes an offer to sell or the solicitation of an offer to buy any security or other investment or an offer to provide investment services of any kind. As such, advisors and their clients should not act on any recommendation (express or implied) or information in this report without obtaining specific advice in relation to their accounts and should not rely on information herein as the primary basis for their investment decisions. Information contained herein is based on data obtained from recognized statistical services, issuer reports or communications, or other sources, believed to be reliable. SIACharts Inc. nor its third party content providers make any representations or warranties or take any responsibility as to the accuracy or completeness of any recommendation or information contained herein and shall not be liable for any errors, inaccuracies or delays in content, or for any actions taken in reliance thereon. Any statements nonfactual in nature constitute only current opinions, which are subject to change without notice.