
by Lance Roberts, RIA
There are many individuals in the market today who have never been through an actual “bear market.” These events, while painful, are necessary to “reset the table” for outsized market returns in the future. Without such an event, it is highly likely the next decade will foil most financial plans.
No. The March 2020 correction was not a bear market. As noted:
- A bull market is when the price of the market is trending higher over a long-term period.
- A bear market is when the previous advance breaks, and prices begin to trend lower.
The chart below provides a visual of the distinction. When you look at price “trends,” the difference becomes both apparent and useful.
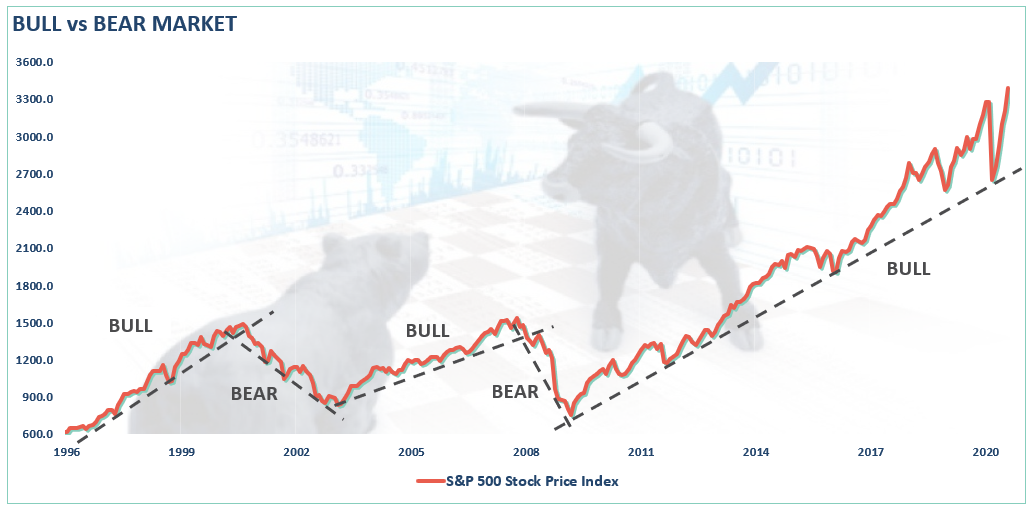
The distinction is essential.
- “Corrections” generally occur over short time frames, do not break the prevailing trend in prices, and are quickly resolved by markets reversing to new highs.
- “Bear Markets” tend to be long-term affairs where prices grind sideways or lower over several months as valuations are reverted.
No Valuation Reversion
The last bullet point is the most important. During “bear markets,” valuations are historically reverted. However, during the 2020 correction, valuations not only did not revert, they actually increased.
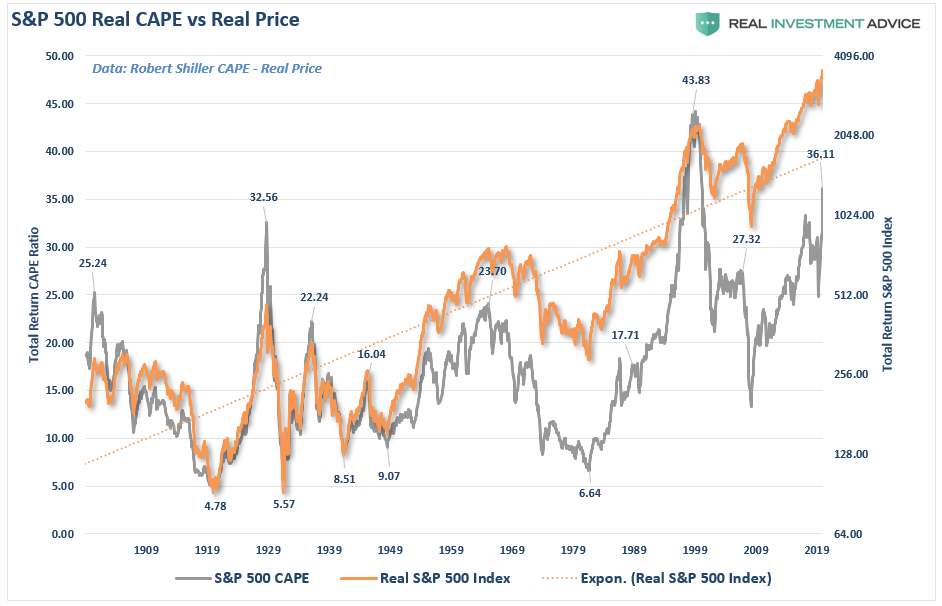
The problem, of course, is that valuations tell you everything about “future returns” on invested capital. Such should be relatively obvious. If you overpay for a car, a house, or a tract of raw land, when you go to sell it, you will most likely not make money. The same holds true for capital invested in markets.
However, in the midst of a “raging bull market,” investors, in the short-term, lose sight of this long-term reality. As Howard Marks noted in a recent Bloomberg interview:
“Fear of missing out has taken over from the fear of losing money. If people are risk-tolerant and afraid of being out of the market, they buy aggressively, in which case you can’t find any bargains. That’s where we are now. That’s what the Fed engineered by putting rates at zero.
“We are back to where we were a year ago—uncertainty, prospective returns that are even lower than they were a year ago, and higher asset prices than a year ago. People are back to having to take on more risk to get return. At Oaktree, we are back to a cautious approach. This is not the kind of environment in which you would be buying with both hands.
The prospective returns are low on everything.”
There are two main reasons why returns over the next decade, or two, are currently being overestimated. The first is a “you problem,” the second is “math”.
It’s A You Problem
One of the biggest impediments to achieving long-term investment returns is the impact of emotionally driven investment mistakes.
Investor psychology is helpful in understanding the specific thoughts and actions that lead to poor decision-making. That psychology not only drives the “buy high/sell low” syndrome, but also the traps, triggers, and misconceptions that lead to a variety of irrational mistakes that reduce returns over time.
There are 9-distinct behaviors that tend to plague investors based on their personal experiences and unique personalities.
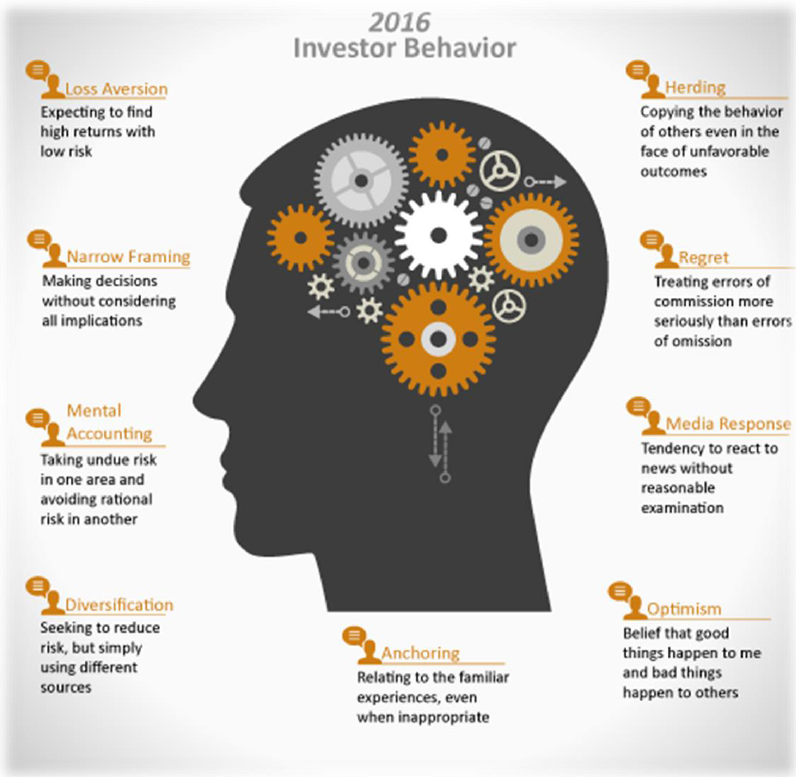
The biggest of these problems for individuals is the “herding effect” and “loss aversion.”
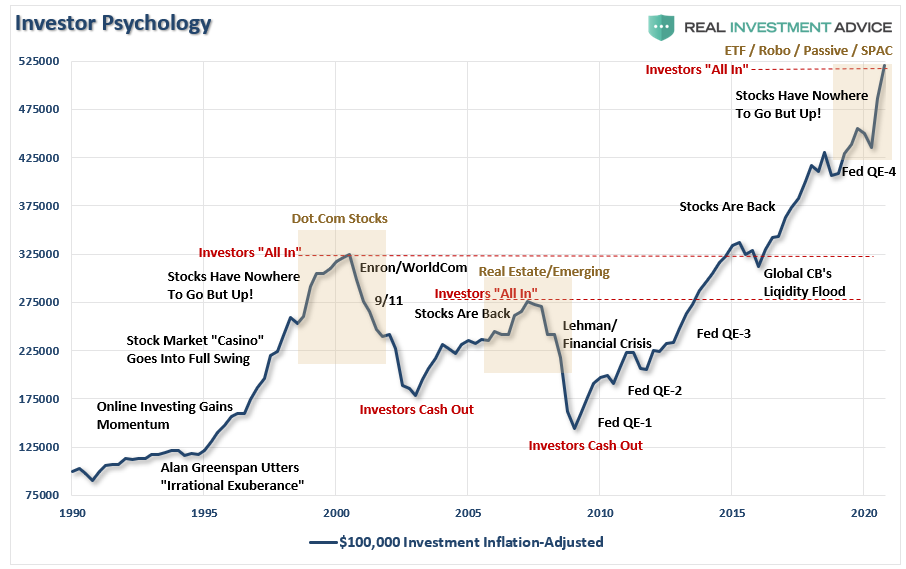
These two behaviors tend to function together compounding the issues of investor mistakes over time. As markets are rising, individuals are lead to believe that the current price trend will continue to last for an indefinite period. The longer the rising trend lasts, the more ingrained the belief becomes until the last of “holdouts” finally “buy-in” as the financial markets evolve into a “euphoric state.”
As the markets decline, there is a slow realization that “this decline” is something more than a “buy the dip” opportunity. When losses mount, the anxiety of loss increases until individuals seek to “avert further loss” by selling.
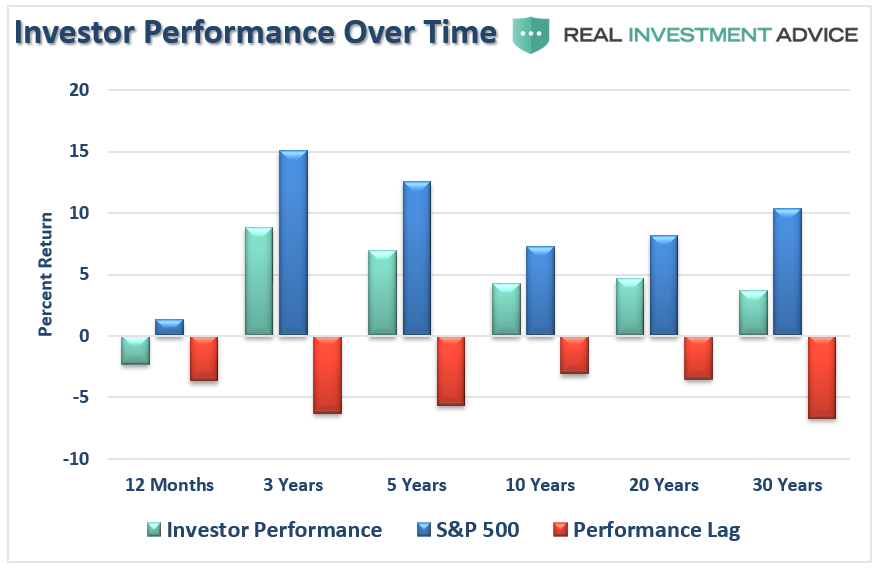
The chart below shows that the behavioral trend runs counter-intuitive to the “buy low/sell high” investment rule.”
The impact of these emotionally driven mistakes leads to long-term under-performance well below those “goal-based” financial projections. According to Dalbar, this underperformance exists over exceptionally long time frames.
It’s Just Math
The vast majority of Americans actually have a relatively short timeframe in which to accumulate assets for retirement. For most, by the time a point in life is reached where one can seriously accumulate savings, it is about 15-20 years.
And therein lies the problem.
As we have discussed previously in “Rationalizing High Valuations:”
“The mistake investors repeatedly make is dismissing the data in the short-term because there is no immediate impact on price returns. As noted above, valuations by their very nature are HORRIBLE predictors of 12-month returns. Investors avoid any investment strategy which has such a focus. In the longer term, however, valuations are strong predictors of expected returns.”
The charts below show the 10 and 20-year rolling REAL, inflation-adjusted, returns for the market as compared to trailing valuations.
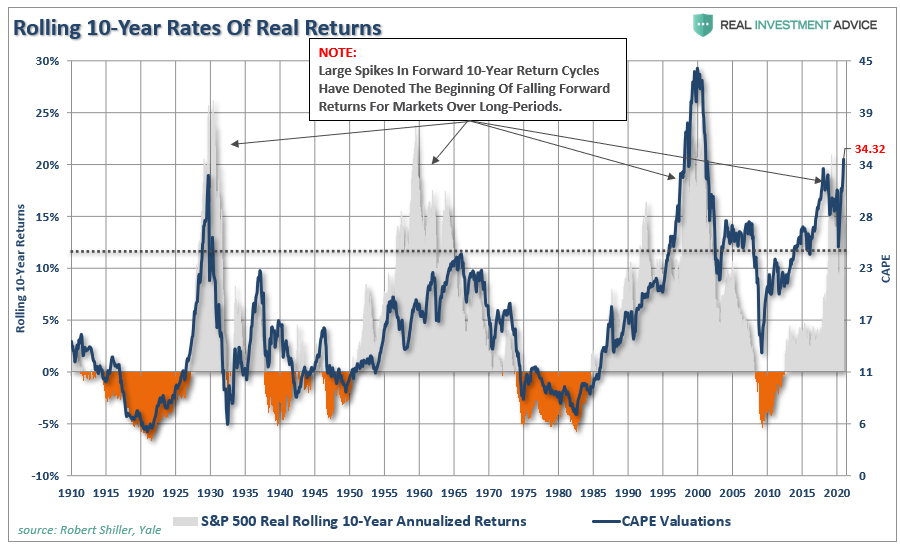
(Important note: Many advisers/analysts often pen that the market has never had a 10 or 20-year negative return. That is only on a nominal basis. Inflation must be included in the debate.)
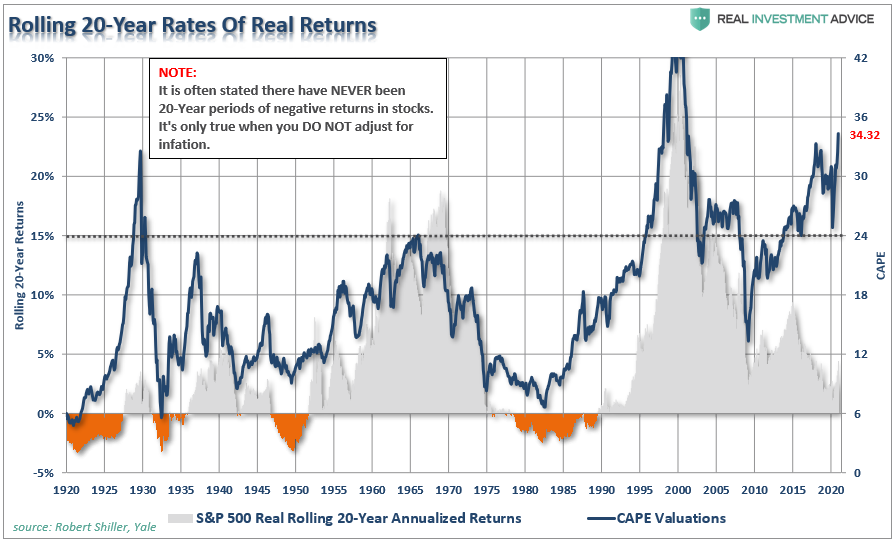
As we pointed out in “Do You Feel Lucky,” virtually all measures of valuation currently suggest that forward returns over the next decade, or longer, will be low.
There are two important points to take away from the data. First, there are several periods throughout history where market returns were not only low but negative. Secondly, the periods of low returns follow periods of excessive market valuations.
This Time Is Not Different.
As David Leonhardt noted previously:
“The classic 1934 textbook ‘Security Analysis’ – by Benjamin Graham, a mentor to Warren Buffett, and David Dodd – urged investors to compare stock prices to earnings over ‘not less than five years, preferably seven or ten years.’ Ten years is enough time for the economy to go in and out of recession. It’s enough time for faddish theories about new paradigms to come and go.”
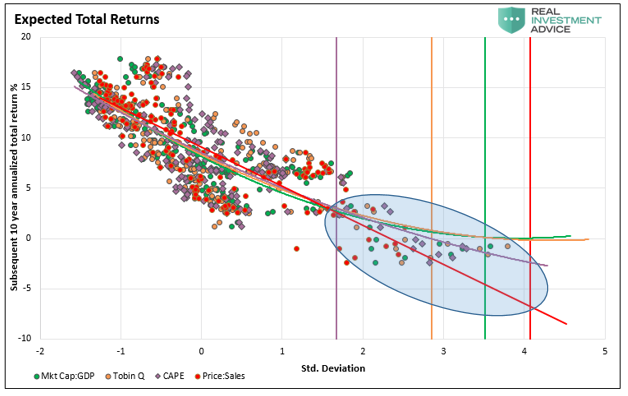
History shows that valuations above 23x earnings have tended to denote secular bull market peaks. Conversely, valuations at 7x earnings, or less, have tended to denote secular bull market starting points.
This point can be proven not only by looking at the distribution of returns in the chart below but mathematically as well.
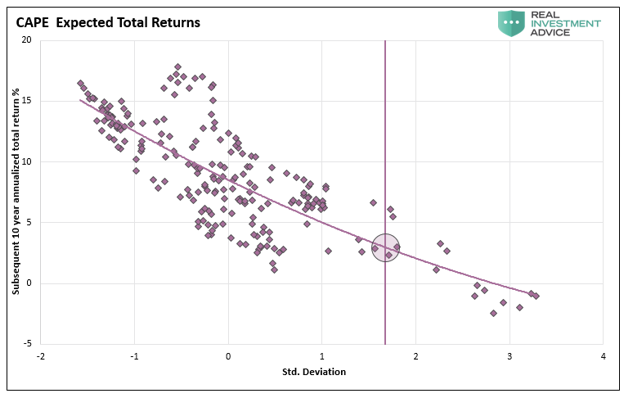
Capital gains from markets are primarily a function of market capitalization, nominal economic growth plus the dividend yield. Using John Hussman’s formula we can mathematically calculate returns over the next 10-year period as follows:
(1+nominal GDP growth)*(normal market cap to GDP ratio / actual market cap to GDP ratio)^(1/10)-1
Therefore, IF we assume that GDP could maintain 2% annualized growth in the future, with no recessions, AND IF current market cap/GDP stays flat at 1.25, AND IF the dividend yield remains at roughly 2%, we get forward returns of:
(1.02)*(1.2/1.5)^(1/10)-1+.02 = 1.75%
But there is a “whole lotta ifs” in that assumption. More importantly, if we assume that inflation remains stagnant at 2%, as the Fed hopes, this would mean a real rate of return of -0.25%.
In either case, these numbers are well below the majority of financial plan projections which will leave retirees well short of their expected retirement goals.
Conclusion
While the majority of analysis is based on the idea that individuals should “buy and hold” indexed based portfolios, reality has been far different.
With retirement plans having a finite time span for both accumulation and distribution of assets, the time lost in “getting back to even” following a major market correction is the primary consideration.
The chart below picks up on the investor psychology chart first shown above. The chart below illustrates the difference between expectations and reality. The illustration shows the difference between the inflation-adjusted return on a $100,000 investment in the S&P 500 growing at 8% annually as opposed to the impact of gains and losses in market returns over time. The reason the chart begins in 1990, despite analysis showing 120-year investment returns, is that covers almost all investors in the markets currently.
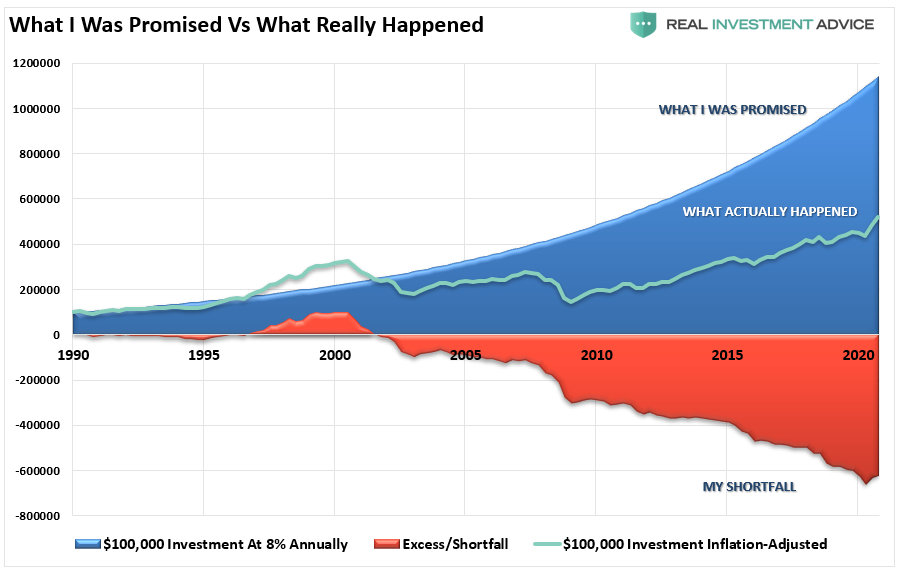
Unfortunately, most investors remain woefully behind their promised financial plans. Given current valuations, and the ongoing impact of “emotional decision making,” the outcome is not likely going to improve over the next decade, or possibly two.
Conclusion
Markets are not cheap by any measure. If earnings growth fails to grow sharply, interest rates rise, not to mention the impact of demographic trends, the bull market thesis will collapse as “expectations” collide with “reality.”
Such is not a dire prediction of doom and gloom, nor is it a “bearish” forecast. It is just a function of how the “math works over time.”
For investors, understanding potential returns from any given valuation point is crucial when considering putting their “savings” at risk. Risk is an important concept as it is a function of “loss.”
The more risk that is taken within a portfolio, the greater the destruction of capital will be when reversions occur.
This time is “not different.” The only difference will be what triggers the next valuation reversion and when it eventually occurs. Two bear markets taught many this lesson. Currently, there is a whole generation of investors who will have to learn this lesson the hard way.