
by Richard Bernstein Advisors
November 2020
Insights
Our top-down macro approach differentiates our firm from the more common, traditional bottom-up approach of most asset managers. Our extensive array of macro indicators allows us to construct portfolios for clients that are innovative, risk-controlled, and focused on overall portfolio construction instead of individual stock selection.
Will growth investors have the nerve to be contrarians?
The word “contrarian” is often used to describe value investors who buy very out-of-favor stocks with depressed prices. However, our research from the
1990s showed that definition was too narrow. Regardless of whether one is a growth or value investor, successful investing is ALWAYS about being a contrarian.
The traditional definition of buying depressed assets does indeed apply to value investors. Successful value investors are definitionally contrarian buyers. However, superior performance is not a function of buying early as many value investors suggest. Value investors often like to claim they “buy early, but will be invested at the bottom”, but that is a sure strategy for underperformance.
Contrarian investing is rarely used to describe growth investors, but being a contrarian is equally important to successful growth investing as it is to successful value investing except growth investors need to be contrarian sellers.
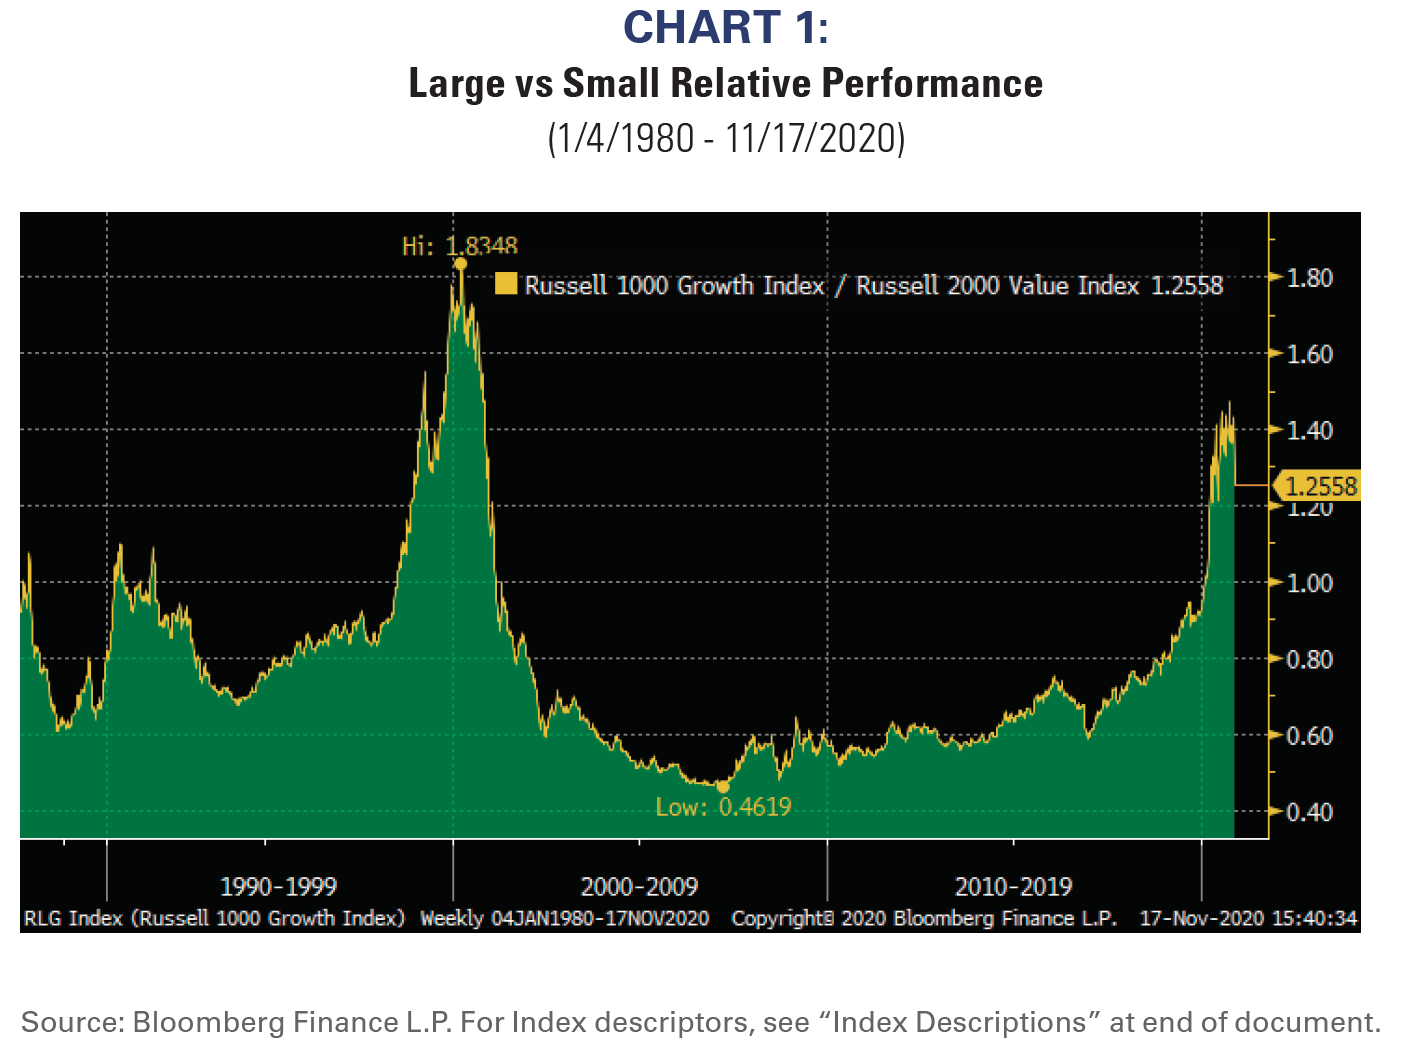
We thought it appropriate to revisit our earlier research given the extreme performance differences between large cap growth stocks and small stock value stocks (see Chart 1). The performance is not as extreme as it was during the Technology Bubble, but one must wonder whether the stretched performance appropriately represents the overall prospects for the US economy and US profitability. Is the outlook for US profitability really so dire that only a handful of companies have a positive growth outlook?
The Earnings Expectations Life Cycle
We developed the Earnings Expectations Life Cycle during the early1990s as a depiction of changing investor attitudes (see Chart 2). Every stock rotates around this cycle. Some may move rapidly, some may move slowly, some may do holding patterns at various points, but every stock does indeed rotate around this cycle.
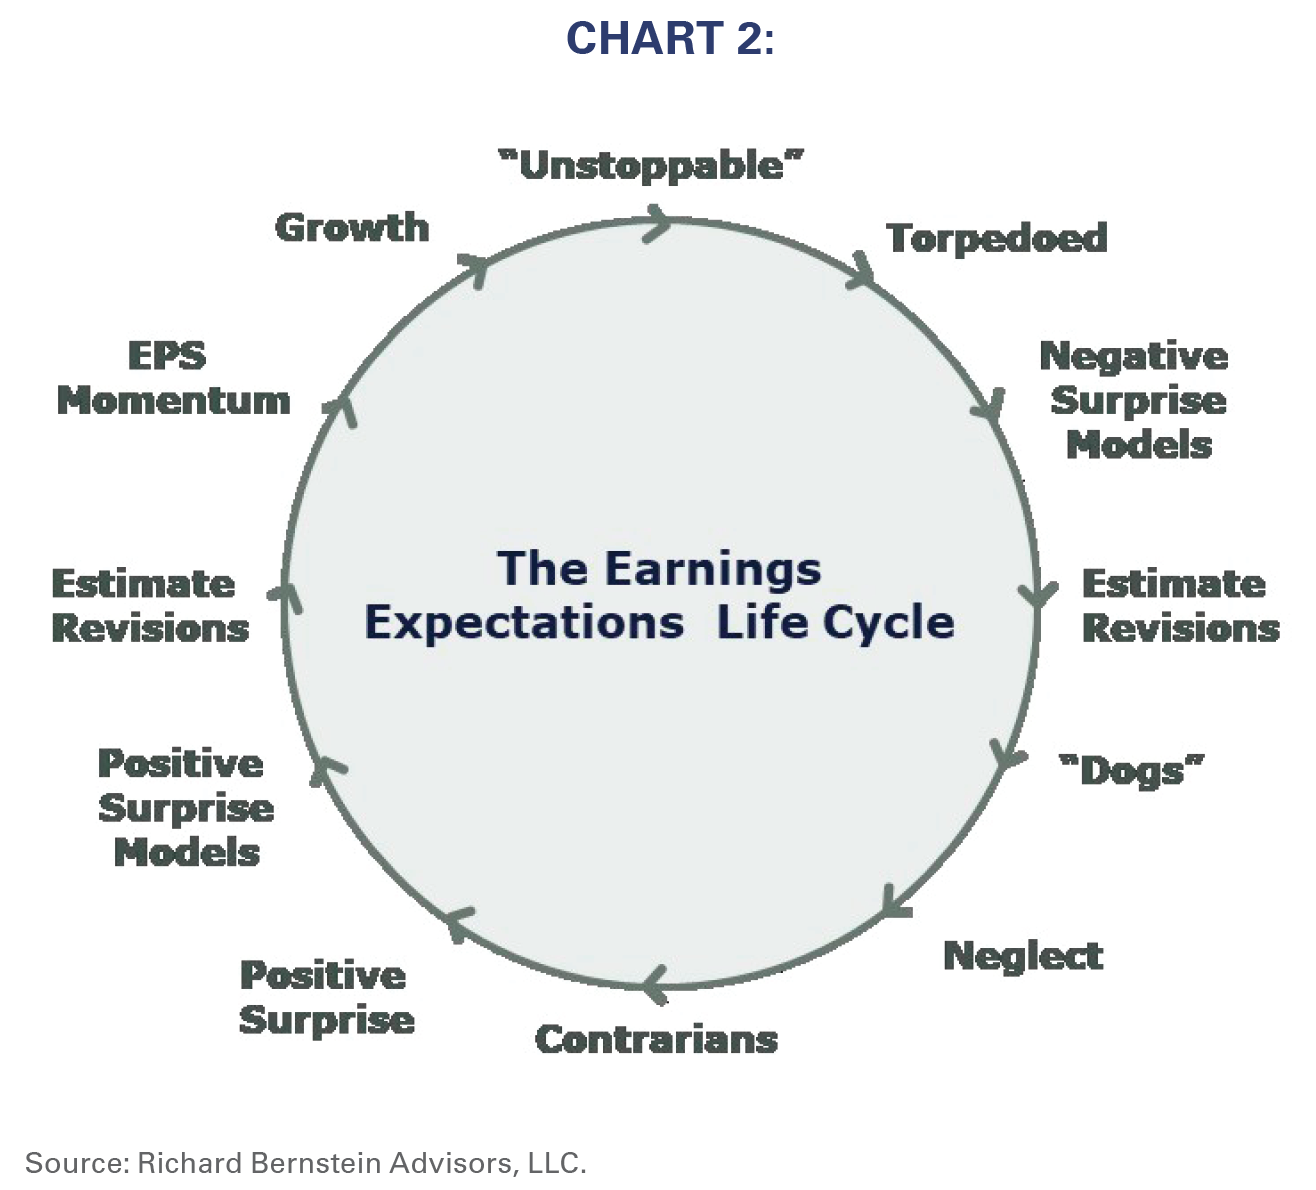
Several aspects of the Earnings Expectations Life Cycle are particularly worth noting:
Both up and down cycles both begin with the general denial that fundamentals are changing. Analysts are typically neither the beginning nor the end of investment ideas. Rather, they react to positive or negative events (i.e., estimate revisions are at 9 o’clock and 3 o’clock).
Maximum enthusiasm for a stock occurs right at the peak of performance (i.e., midnight). Stocks can become so out of favor that buy- and sell-side analysts actually drop coverage (Neglect). Growth versus value investors
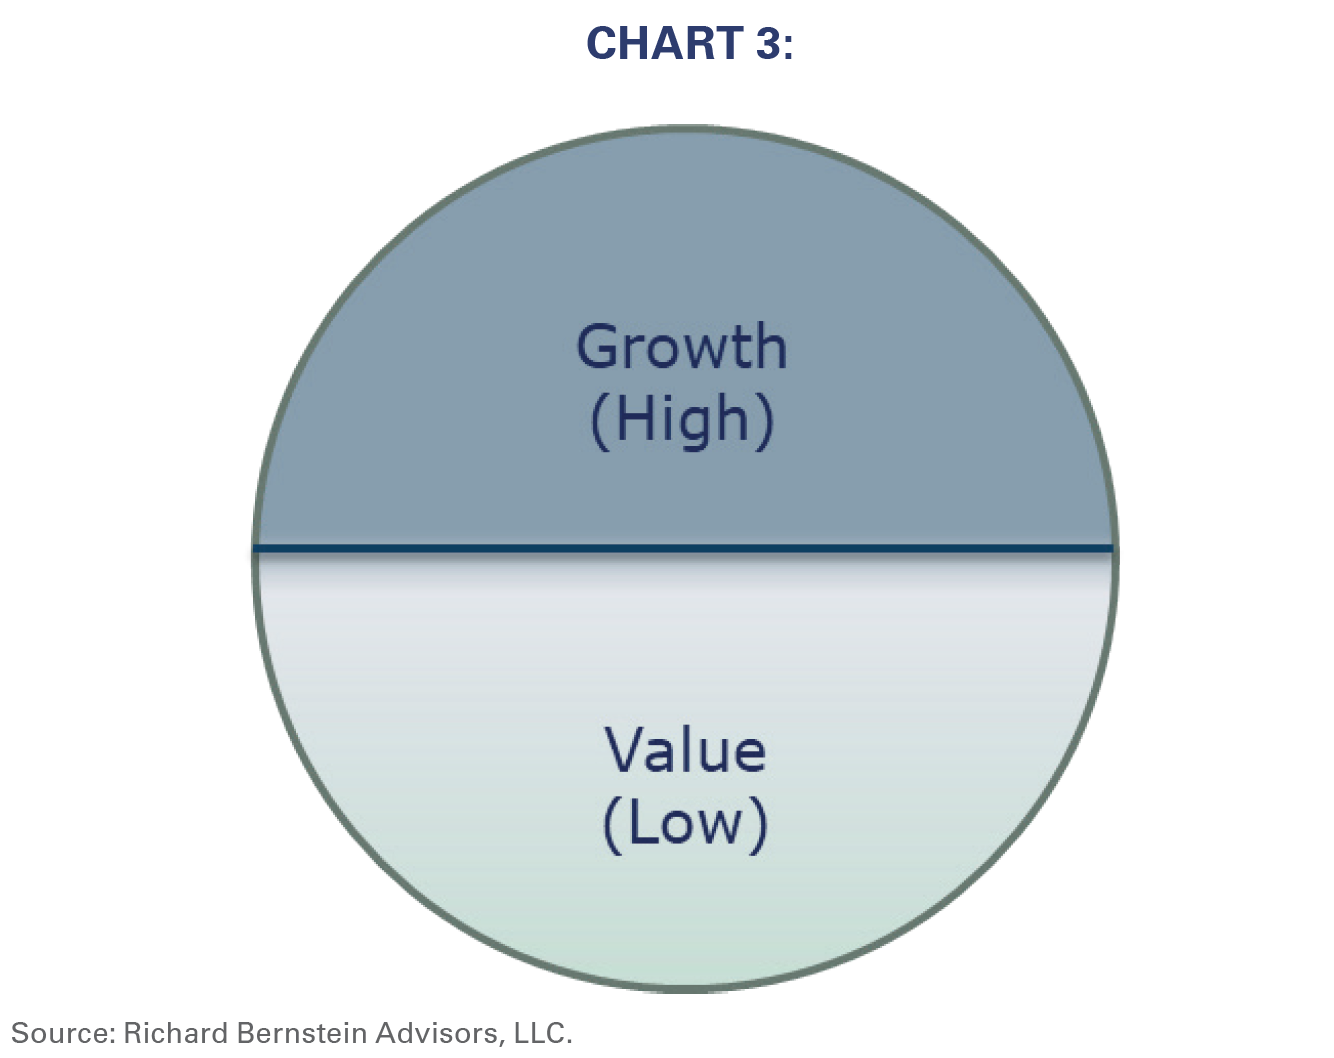
One can outline the universes of stocks in which growth and value investors are typically interested by dividing the Earnings Expectations Life Cycle in half horizontally (see Chart 3). Value investors tend to focus on stocks in the bottom half of the Life Cycle, whereas growth investors tend to focus on stocks in the top half. In other words, value investors focus on stocks with low expectations and growth investors focus on stocks with high expectations.
“Good” versus “bad” investors
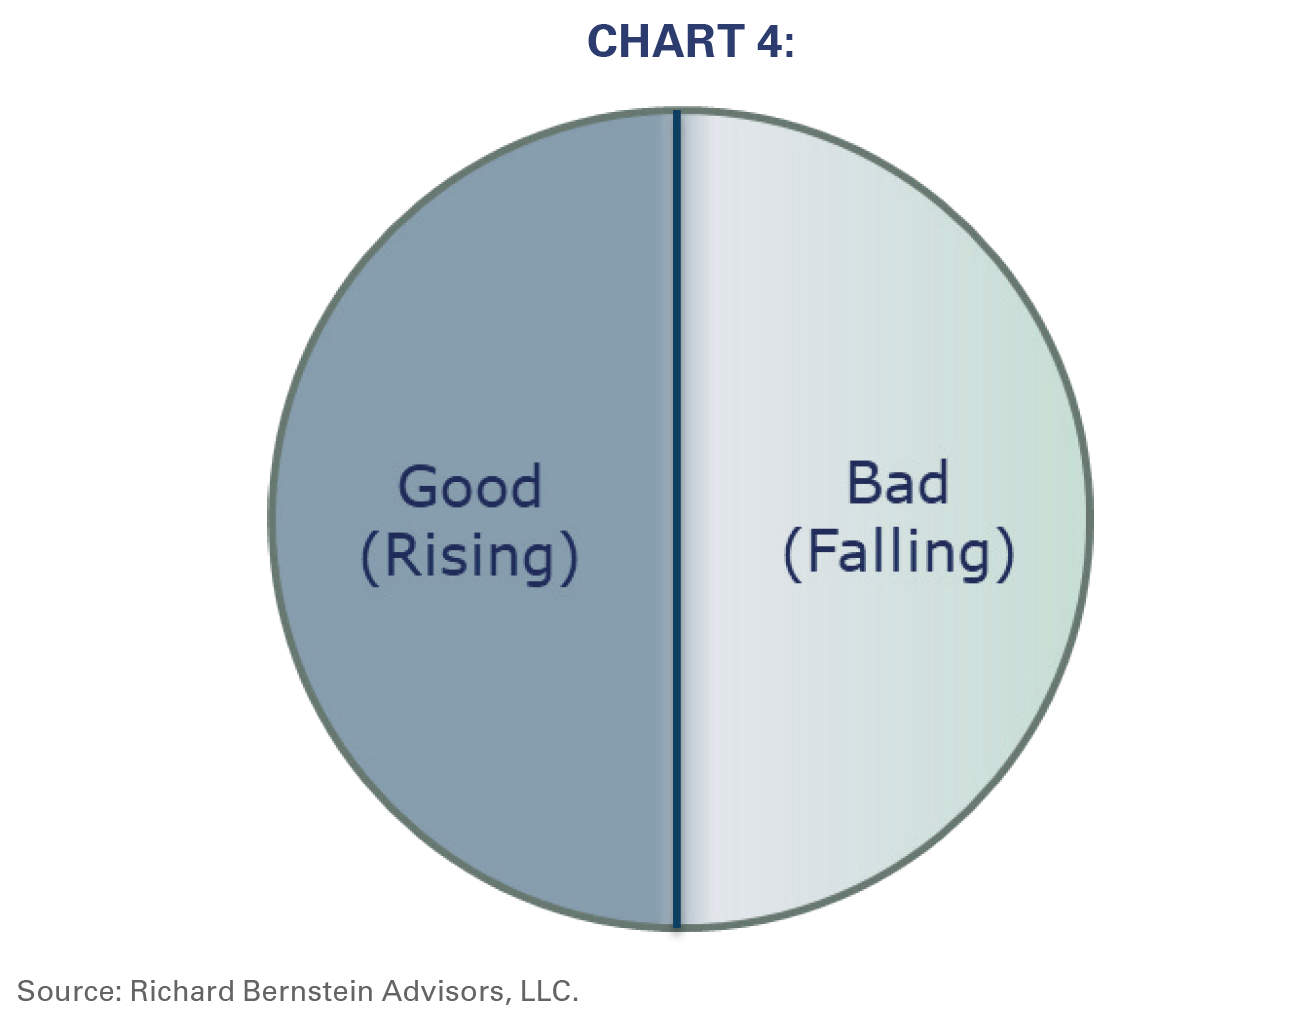
Going one step further, one can divide the Life Cycle vertically into “good” and “bad” investors (see Chart 4). “Good” investors buy stocks with rising expectations, whereas “bad” investors buy stocks with falling expectations.
“Good” vs. “bad” growth and “good” vs. “bad” value
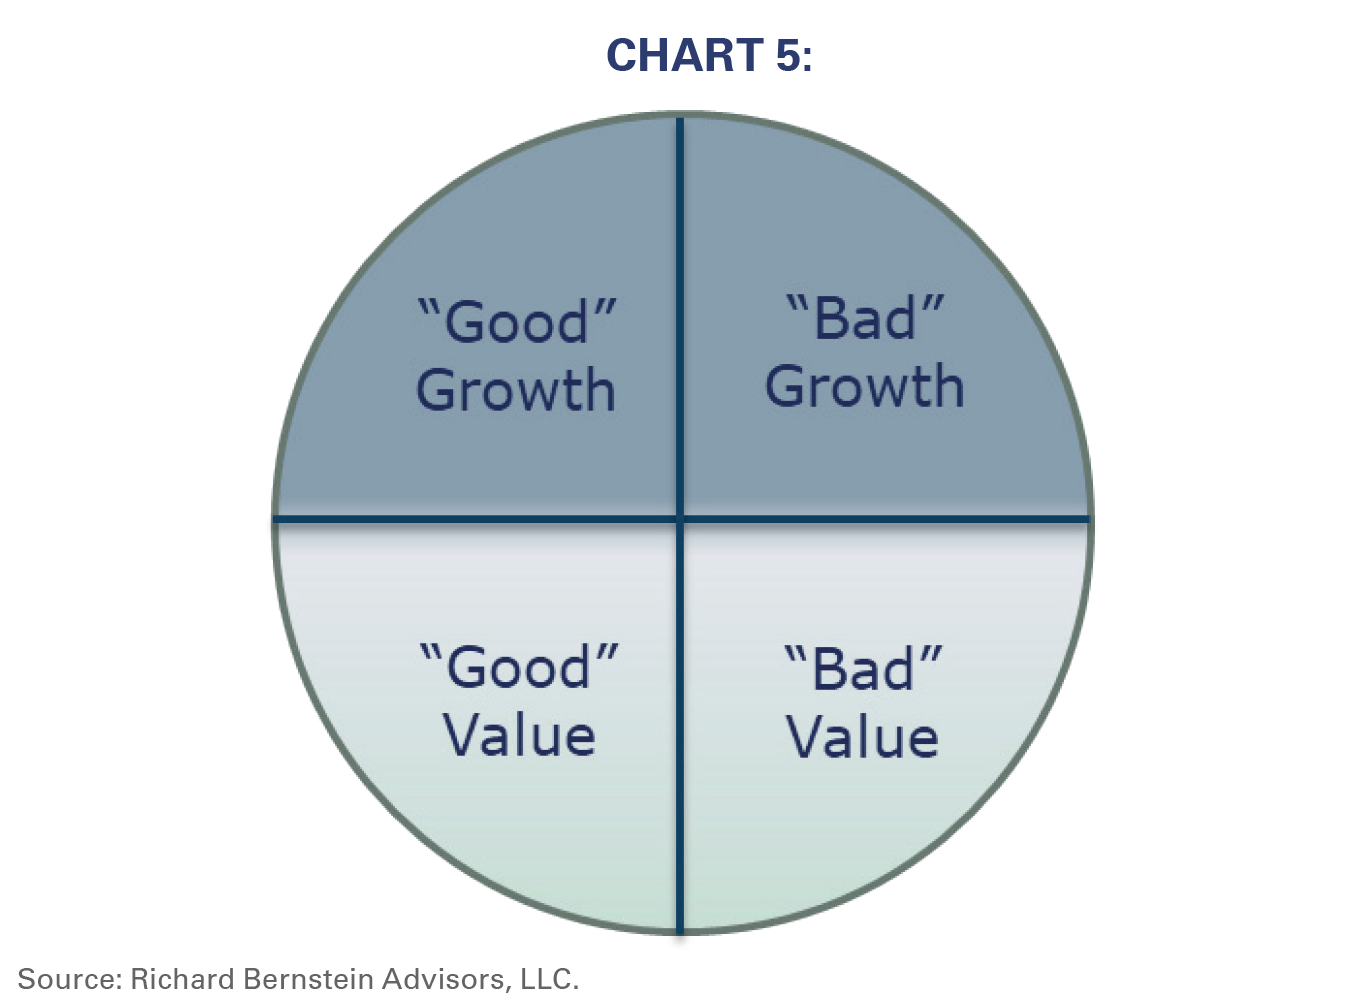
If one now overlays the two previous divisions of the Life Cycle, one gets four sections (see Chart 5): Good Growth, Bad Growth, Bad Value, and Good Value. These four slices help investors understand the characteristics of a good style investor:
Good value investors actually buy stocks later than their peers because the bad value investor “buys early but is there at the bottom”. Value investors underperform when they buy early because fundamentals have yet to bottom and expectations continue to fall.
Value investors really don’t have to worry about sell disciplines as much as buy disciplines. Holding a value stock too long might violate a charter (i.e., a once undervalued stock becomes a growth stock), but it is unlikely to hurt performance.
Good growth investors have to be contrarian sellers. It’s reasonably easy to identify a growth stock, but incredibly difficult to sell right at the apex of performance. Holding a growth stock too long typically results in growth investors’ underperformance. The Life Cycle highlights good value investors have to buy later than peers, but good growth investors have to sell before their peers.
Do you have the nerve to be contrarian?
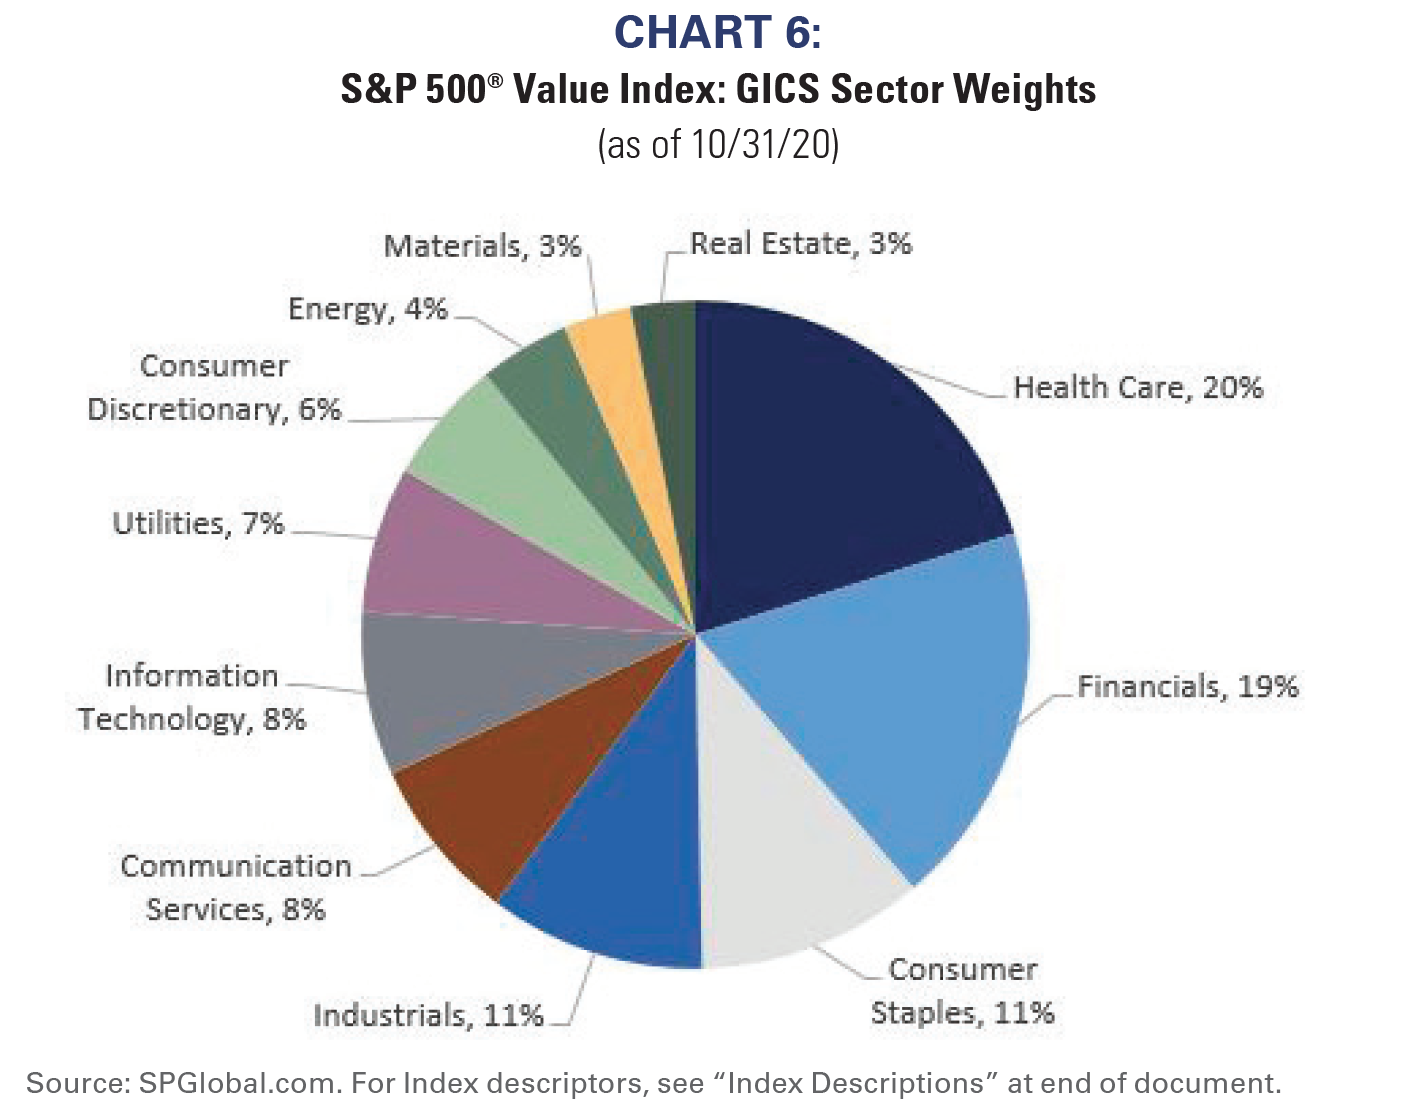
The key question today is not whether value investors have the nerve to be patient when buying sectors like Financial stocks (see Chart 6). Many value investors have already bought value stocks too early and their performance has suffered.
The growth stock universe (defined as the S&P 500® Growth Index) is nearly 60% Technology and FAANG (see Chart 7). Do good growth investors have the ability and the nerve to actually sell those hot stocks at the peak of their performance? That seems to be the key question investors are not asking for 2021. It’s always easy to spot a growth stock, but many growth investors will likely rationalize underperformance and continue to hold positions when technology fundamentals deteriorate.

Historically, growth tends to outperform value when profits cycles decelerate (see Chart 8). Earnings growth becomes increasingly scarce as the cycle deteriorates, and investors flock to the smaller and smaller universe of companies that can maintain growth in an increasingly adverse environment. The pandemic has accentuated the traditional “Darwinistic” (survival of the fittest) narrow leadership, and today we have the “Fab 5” stocks.
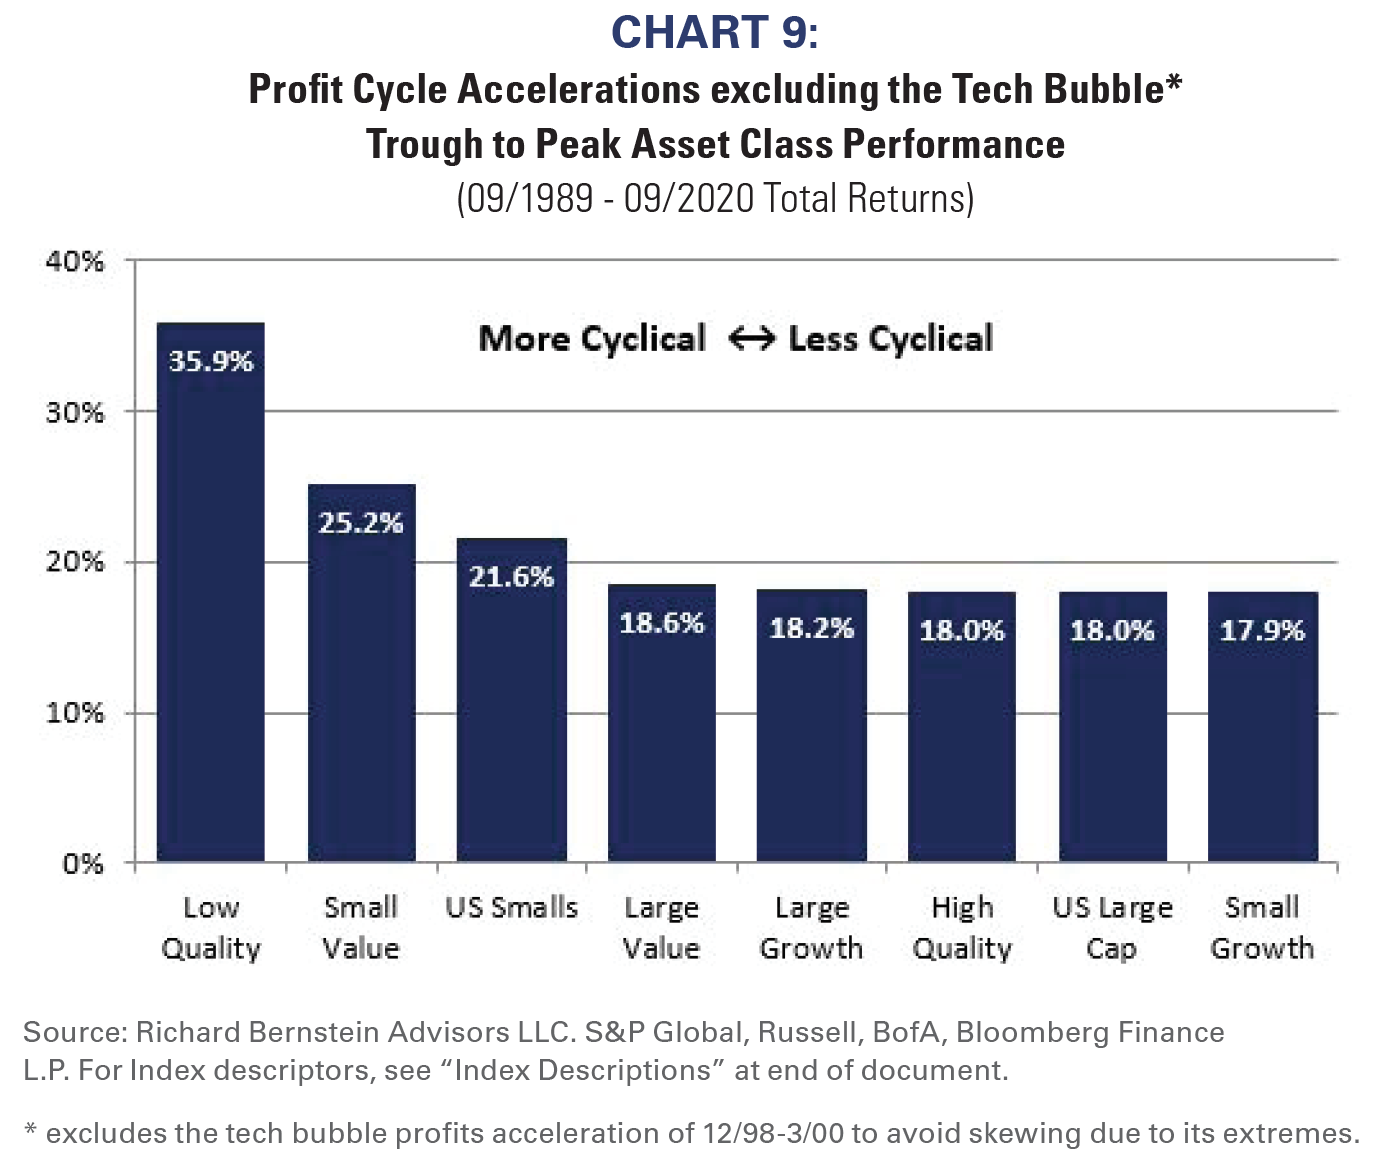
However, history also suggests value tends to outperform growth when profits cycles accelerate (see Chart 9). Investors can increasingly comparison shop for growth as an increasing number of companies start to significantly grow. Comparison shopping is effectively value investing, i.e., investors won’t pay 30 times earnings for 30% growth when many companies are selling at 15 times earnings for 50% growth.
The concept of the Earnings Expectations Life Cycle might seem simply cute to some investors, but 2021 could be the year during which very significant rotations from growth to value, from large to small, and from secular growers to cyclical growers occur because it is highly likely the profits cycle will rebound in 2021.
2020 earnings have been dramatically depressed by the pandemic’s effect on the global economy. If one assumes the pandemic begins to subside as 2021 progresses, then it seems highly likely 2021’s earnings growth will be higher than 2020’s, the profits cycle will trough, and a significant rotation within equity markets will occur.
Value managers have already suffered in 2020 by prematurely anticipating a turn in the profits cycle. Will growth managers have the nerve to be contrarians and sell the global equity markets’ hottest stocks when the cycle troughs in 2021?

*****
INDEX DESCRIPTIONS:
The following descriptions, while believed to be accurate, are in some cases
abbreviated versions of more detailed or comprehensive definitions available from
the sponsors or originators of the respective indices. Anyone interested in such further details is free to consult each such sponsor’s or originator’s website.
The past performance of an index is not a guarantee of future results.
S&P 500® Value: S&P 500® Value Index: The S&P 500® Value Index is a market capitalization weighted index. All the stocks in the underlying parent index are allocated into value or growth. Stocks that do not have pure value or pure growth characteristics have their market caps distributed between the value & growth indices. Prior to 12/19/2005 this index represented the S&P 500® /Barra Value Index
S&P 500® Growth: S&P 500® Growth Index: The S&P 500® Growth Index is a market capitalization weighted index. All the stocks in the underlying parent index are allocated into value or growth. Stocks that do not have pure value or pure growth characteristics have their market caps distributed between the value & growth indices. Prior to 12/19/2005 this index represented the S&P 500® /Barra Growth Index.
Sector/Industries: Sector/industry references in this report are in accordance with the Global Industry Classification Standard (GICS®) developed by MSCI Barra and Standard & Poor’s.
Large Cap: S&P 500® Index: The S&P 500® Index is an unmanaged, capitalization-weighted index designed to measure the performance of the broad US economy through changes in the aggregate market value of 500 stocks representing all major industries.
Small Cap: Russell 2000 Index. The Russell 2000 Index is an unmanaged, market-capitalization-weighted index designed to measure the performance of the small-cap segment of the US equity universe. The Russell 2000 Index is a subset of the Russell 3000® Index.
Large Growth: Russell 1000 Growth Index. The Russell 1000 Growth Index measures the performance of those Russell 1000 companies with higher priceto-book ratios and higher forecasted growth values. The index was developed with a base value of 200 as of August 31, 1992.
Large Value: Russell 1000 Value Index. The Russell 1000 Value Index measures the performance of those Russell 1000 companies with lower priceto-book ratios and lower forecasted growth values. The index was developed with a base value of 200 as of August 31, 1992.
Small Growth: Russell 2000 Growth Index. The Russell 2000 Growth Index measures the performance of those Russell 2000 companies with higher priceto-book ratios and higher forecasted growth values.
Small Value: Russell 2000 Value Index. The Russell 2000 Value Index measures the performance of those Russell 2000 companies with lower priceto-book ratios and lower forecasted growth values.
High Quality:The BofA A+ Quality Index: BofA Quality indices: each month BofA groups all of the stocks in the BofA US research coverage universe based on their Standard and Poor’s quality ranking. The returns are calculated based on the subsequent months’ average price return of each group assuming monthly rebalancing.
Low Quality: The BofA C&D Quality Index: BofA Quality indices: each month BofA groups all of the stocks in the BofA US research coverage universe based on their Standard and Poor’s quality ranking. The returns are calculated based on the subsequent months’ average price return of each group assuming monthly rebalancing.
Sector/Industries: Sector/industry references in this report are in accordance with the Global Industry Classification Standard (GICS®) developed by MSCI Barra and Standard & Poor’s.
FAANG: Acronym for Facebook, Amazon, Apple, Netflix and Alphabet (formerly Google). Under GICS®, Facebook, Alphabet & Netflix are currently classified under Communications Svcs, Amazon under Consumer Discretionary and Apple under Information Technology.
About Richard Bernstein Advisors
Richard Bernstein Advisors LLC is an investment manager focusing on long- only, global equity and asset allocation investment strategies. RBA runs ETF asset allocation SMA portfolios at leading wirehouses, independent broker/ dealers, TAMPS and on select RIA platforms. Additionally, RBA partners with several firms including Eaton Vance Corporation and First Trust Portfolios LP, and currently has $10.5 billion collectively under management and advisement as of October 31st, 2020. RBA acts as sub‐advisor for the Eaton Vance Richard Bernstein Equity Strategy Fund, the Eaton Vance Richard Bernstein All‐Asset Strategy Fund and also offers income and unique theme‐oriented unit trusts through First Trust. RBA is also the index provider for the First Trust RBA American Industrial Renaissance® ETF. RBA’s investment insights as well as further information about the firm and products can be found at www. RBAdvisors.com.
Nothing contained herein constitutes tax, legal, insurance or investment advice, or the recommendation of or an offer to sell, or the solicitation of an offer to buy or invest in any investment product, vehicle, service or instrument. Such an offer or solicitation may only be made by delivery to a prospective investor of formal offering materials, including subscription or account documents or forms, which include detailed discussions of the terms of the respective product, vehicle, service or instrument, including the principal risk factors that might impact such a purchase or investment, and which should be reviewed carefully by any such investor before making the decision to invest. RBA information may include statements concerning financial market trends and/or individual stocks, and are based on current market conditions, which will fluctuate and may be superseded by subsequent market events or for other reasons. Historic market trends are not reliable indicators of actual future market behavior or future performance of any
particular investment which may differ materially, and should not be relied upon as such. The investment strategy and broad themes discussed herein may be inappropriate for investors depending on their specific investment objectives and financial situation. Information contained in the material has been obtained from sources believed to be reliable, but not guaranteed. You should note that the materials are provided “as is” without any express or implied warranties. Past performance is not a guarantee of future results. All investments involve a degree of risk, including the risk of loss. No part of RBA’s materials may be reproduced in any form, or referred to in any other publication, without express written permission from RBA. Links to appearances and articles by Richard Bernstein, whether in the press, on television or otherwise, are provided for informational purposes only and in no way should be considered a recommendation of any
particular investment product, vehicle, service or instrument or the rendering of investment advice, which must always be evaluated by a prospective investor in consultation with his or her own financial adviser and in light of his or her own circumstances, including the investor’s investment horizon, appetite for risk, and ability to withstand a potential loss of some or all of an investment’s value. Investing is subject to market risks. Investors acknowledge and accept the potential loss of some or all of an investment’s value. Views represented are subject to change at the sole discretion of Richard Bernstein Advisors LLC. Richard Bernstein Advisors LLC does not undertake to advise you of any changes in the views expressed herein.
© Copyright 2020 Richard Bernstein Advisors LLC. All rights reserved.
PAST PERFORMANCE IS NO GUARANTEE OF FUTURE RESULTS
*****
Richard Bernstein Advisors
Richard Bernstein Advisors LLC (RBA) is an investment manager focusing on longer-term investment strategies that combine top-down, macroeconomic analysis and quantitatively-driven portfolio construction. We strive to be the leading provider of innovative investment solutions for investors, and our competitive edge is our research- driven macro style of investing.