


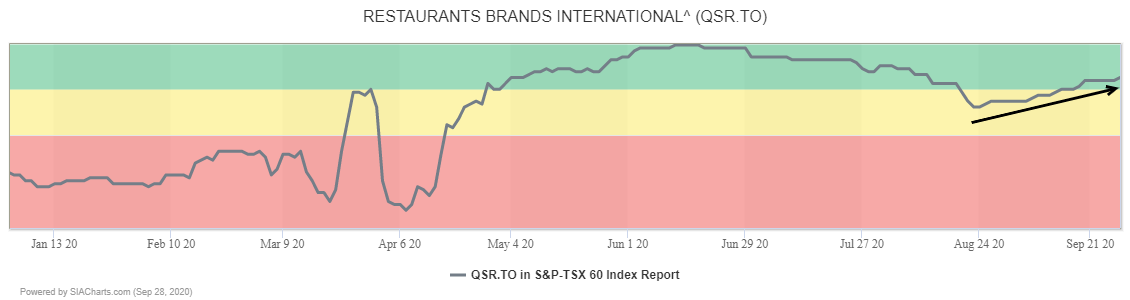
Tim Hortons parent Restaurant Brands International (QSR.TO) recently returned to the Green Favored Zone of the SIA S&P/TSX 60 Index report. It continues to climb up the rankings moving up another spot yesterday to 12th place.

Restaurant Brands International (QSR.TO) recently completed a successful retest of support at the bottom of its current $70.00 to $80.00 trading channel. Lately, signs of renewed accumulation have emerged with the shares starting to climb again and snapping out of a downtrend.
A breakout over $80.00 would complete the current consolidation phase and confirm the start of a new advance with next potential resistance at the previous peak near $86.00, then a measured $90.00.
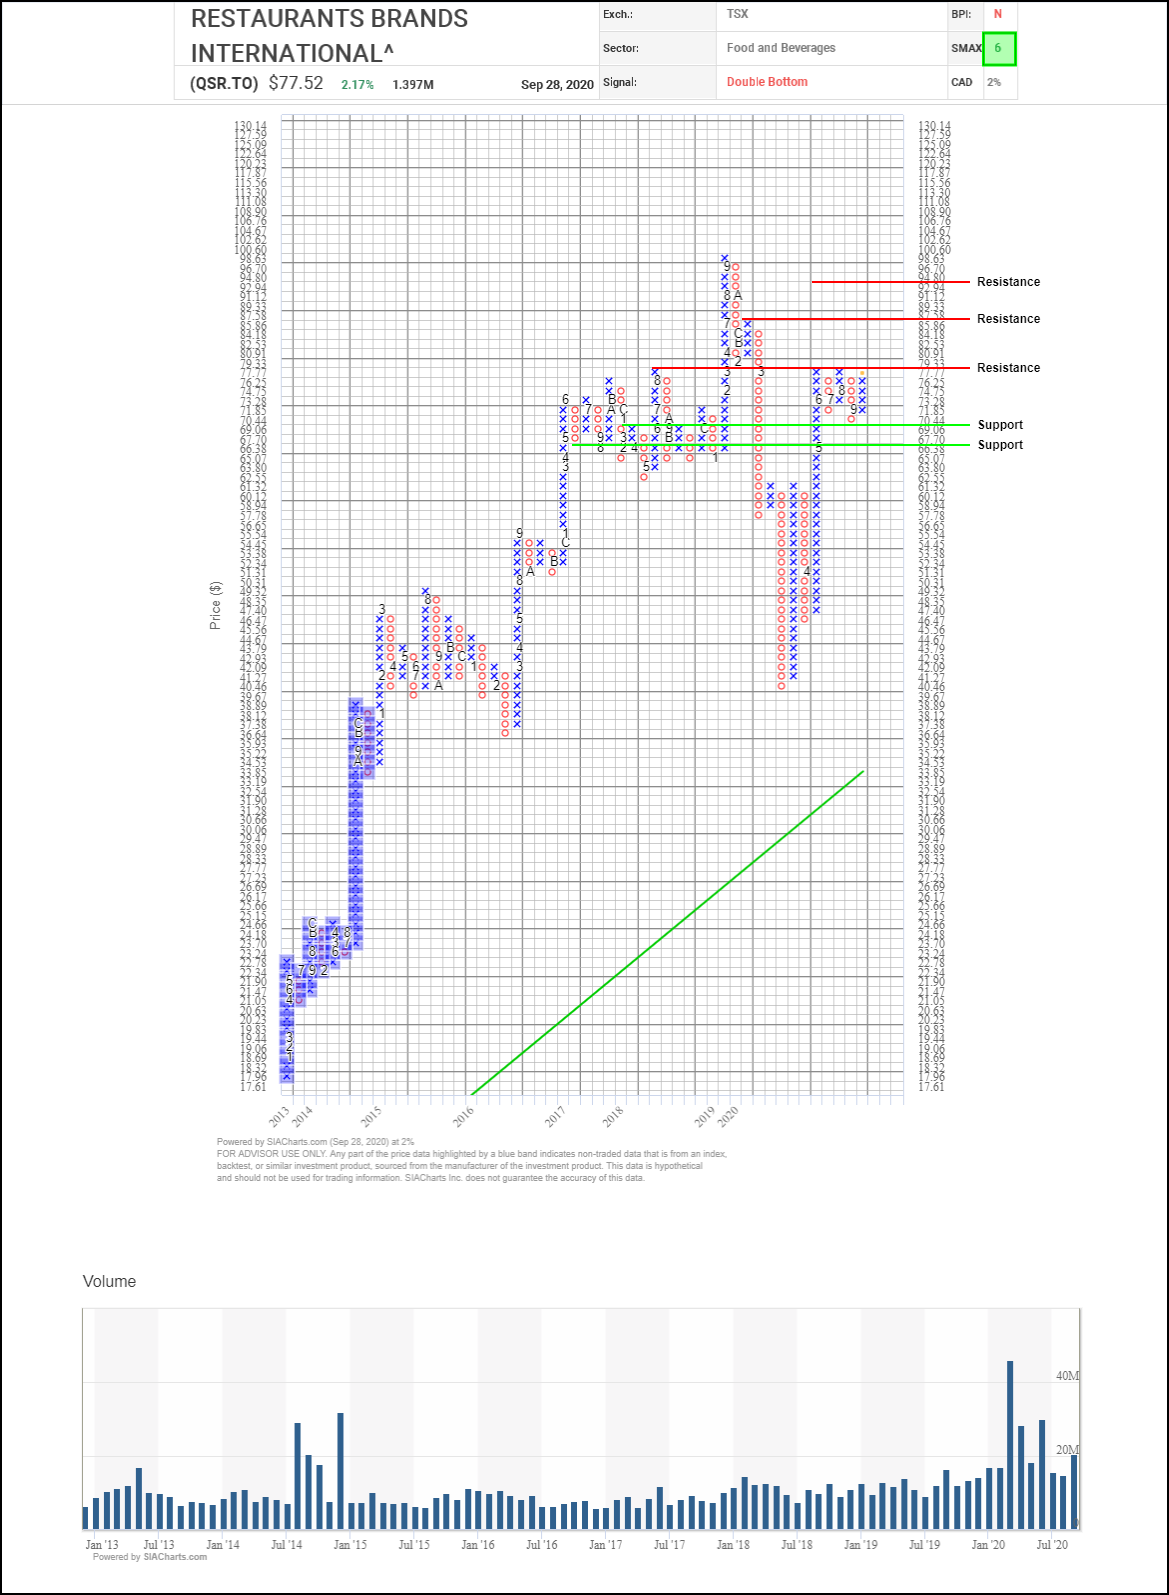
Since completing a spring rebound, Restaurant Brands International (QSR.TO) shares have been consolidating their gains in a range between support in the $70.00 to $72.00 area (round number, recent low and 3-box reversal and channel resistance plus a round number in the $79.00 to $80.00 area.
A recent double bottom breakdown didn’t generate much follow through and QSR.TO has turned back upward into a column of Xs. A breakout over $79.35 would complete a bullish triple top pattern and signal the start of a new upleg with next potential resistance near $87.60 based on a previous column high.
With a bullish SMAX score of 6, QSR.TO is exhibiting near-term strength against the asset classes.
Disclaimer: SIACharts Inc. specifically represents that it does not give investment advice or advocate the purchase or sale of any security or investment whatsoever. This information has been prepared without regard to any particular investors investment objectives, financial situation, and needs. None of the information contained in this document constitutes an offer to sell or the solicitation of an offer to buy any security or other investment or an offer to provide investment services of any kind. As such, advisors and their clients should not act on any recommendation (express or implied) or information in this report without obtaining specific advice in relation to their accounts and should not rely on information herein as the primary basis for their investment decisions. Information contained herein is based on data obtained from recognized statistical services, issuer reports or communications, or other sources, believed to be reliable. SIACharts Inc. nor its third party content providers make any representations or warranties or take any responsibility as to the accuracy or completeness of any recommendation or information contained herein and shall not be liable for any errors, inaccuracies or delays in content, or for any actions taken in reliance thereon. Any statements nonfactual in nature constitute only current opinions, which are subject to change without notice.