by Don Vialoux, EquityClock.com
The Bottom Line
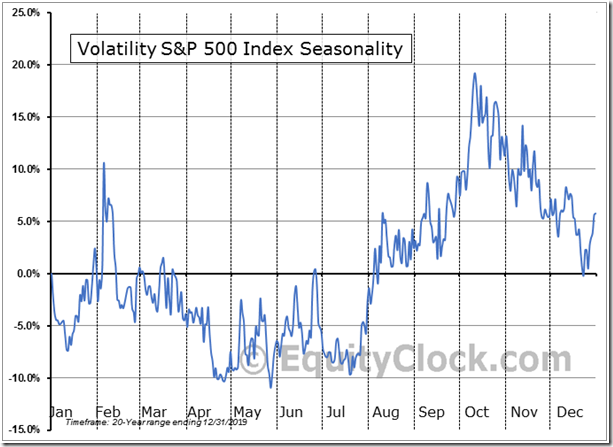
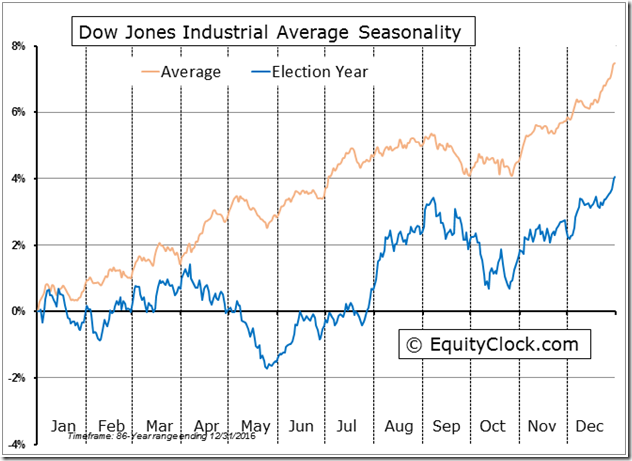
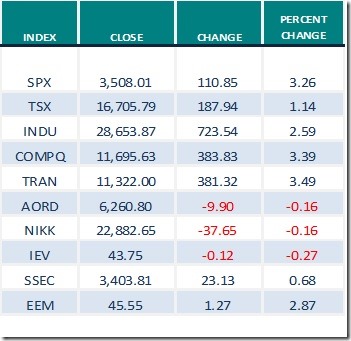
Major equity indices around the world were mixed last week: U.S, Canadian, Chinese and Emerging Market indices moved higher while European, Australian and Japanese indices moved lower. Major influences remain focused on a second wave of the coronavirus (negative) and possibility of approval of a vaccine (positive). Momentum indicators for North American equity markets remained intermediate overbought and past their peak. The VIX Index remained elevated and showed early signs of a recovery last week. It typically moves higher between now and early October. Seasonal influences for most equity markets around the world tend to be slightly negative between now and mid-October (particularly the TSX Composite Index and U.S. equity indices during U.S. Presidential election years). Look for volatile, choppy equity markets between now and at least mid-October.
Observations
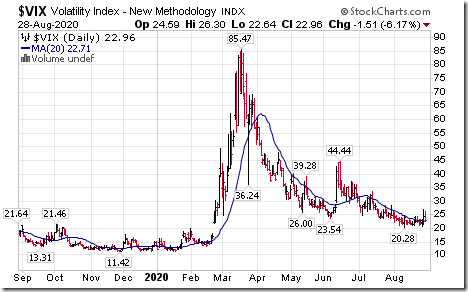
The VIX Index (better known as the Fear Index) remained elevated last week and showed early technical signs of moving higher on a move above its 20 day moving average.
The Dow Jones Industrial Average during U.S. Presidential Election years has a history of moving higher to the end of August (when the Democrat and Republican conventions reach a conclusion), moving lower to the end of October and moving higher after the election.
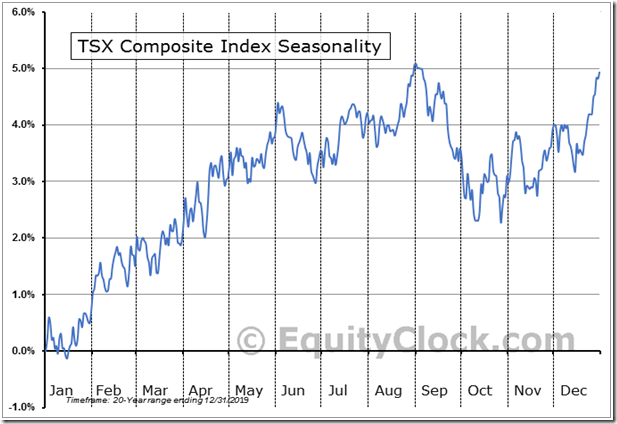
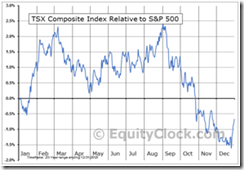
The TSX Composite Index has a history of moving lower on a real and relative basis from the beginning of September to at least the middle of October.
S&P/TSX Composite Index Seasonal Chart
$TSX Relative to the S&P 500
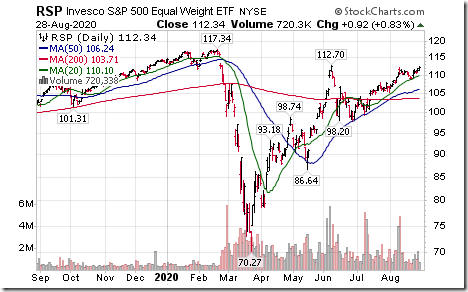
Although the capitalization weighted S&P 500 Index reached an all-time high last week, the equal weighted S&P 500 Index and its related ETF remained below highs set at 112.70 in mid-June and 117.34 set in mid-February. Almost all of the gain since mid-June by the capitalization weighted S&P 500 Index came from the FAANG stocks plus Microsoft. Last week, Facebook, Amazon, Apple, Netflix, GOOGLE (Alphabet) and Microsoft reached all-time highs.
Note the high correlation of this chart with the S&P 500 Momentum Chart included at the end of this report.
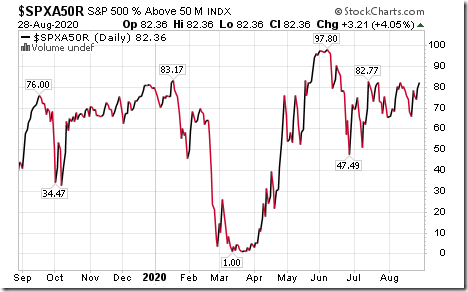
Medium term technical indicator for U.S. equity markets (e.g. Percent of S&P 500 stocks trading above their 50 day moving average) moved higher last week. It remains intermediate overbought. See Barometer chart at the end of this report.
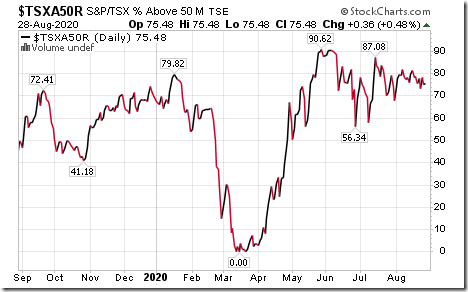
Medium term technical indicator for Canadian equity markets slightly also moved higher last week. It remains overbought. See Barometer chart at the end of this report.
More short term short term momentum indicators for U.S. markets/commodities/sectors (20 day moving averages, short term momentum indicators) moved higher last week (particularly commodities on U.S. Dollar weakness).
More short term momentum indicators for Canadian markets/sectors also moved higher last week.
Year-over-year 2020 consensus earnings declines by S&P 500 companies have been changed slightly since the last report released on August 10th. Ninety eight percent of companies have reported second quarter results to date with 84% reporting higher than consensus earnings. According to FactSet, second quarter 2020 earnings are expected to fall 31.8% (versus a drop of 33.8% in the previous report) and revenues are expected to drop 8.7% (versus previous 9.8%). Third quarter earnings are expected to fall 22.5% (versus previous 22.9%) and revenues are expected to decrease 4.1% (versus previous 4.4%). Fourth quarter earnings are expected to drop 13.1% (versus previous 12.8%) and revenues are expected to decline 2.9% (versus previous 1.4%). Earnings for all of 2020 are expected to fall 18.6% (versus previous 19.0%) and revenues are expected to decline 2.9% (versus previous 3.2%).
Consensus estimates for earnings and revenues by S&P 500 companies turn positive on a year-over-year basis in the first quarter of 2021. According to FactSet, earnings in the first quarter of 2021 are expected to increase 13.1% (versus previous 12.9%) and revenues are expected to increase 3.1%. Earnings for all of 2021 are expected to increase 26.2% (versus previous 26.5%) and revenues are expected to increase 8.1% (versus previous 8.4%).
Economic News This Week
July Construction Spending to be released at 10:00 AM EDT on Tuesday is expected to increase 1.0% versus a decline of 0.7% in June.
August Manufacturing ISM to be released at 10:00 AM EDT on Tuesday is expected to slip to 54.5 from 54.2 in August.
August ADP Employment Report to be released at 8:15 AM EDT on Wednesday is expected to reach 900.000 versus a gain of 167,000 in July.
July Factory Orders to be released at 10:00 AM EDT on Wednesday are expected to increase 6.0% versus a gain of 6.2% in June.
Next estimate of second quarter Non-farm Productivity to be released at 8:30 AM EDT on Thursday is expected to remain unchanged at 7.3%.
July U.S. Trade Deficit to be released at 8:30 AM EDT on Thursday is expected to increase to $52.30 billion from $50.70 billion in June.
July Canadian Trade Deficit to be released at 8:30 AM EDT on Thursday is expected to increase to $2.50 billion from $3.19 billion in June.
August ISM Services to be released at 10:00 AM EDT on Thursday is expected to slip to 57.0 from 58.1 in July.
August Non-farm Payrolls to be released at 8:30 AM EDT on Friday are expected to reach 1,400,000 versus 1,763,000 in July. August Unemployment Rate is expected to slip to 9.8% from 10.3% in July.
Canadian August Employment to be released at 8:30 AM EDT on Friday is expected to reach 300,000 versus 418,500 in July. August Unemployment Rate is expected to slip to 10.2 from 10.9 in July.
Selected Earnings Report News This Week
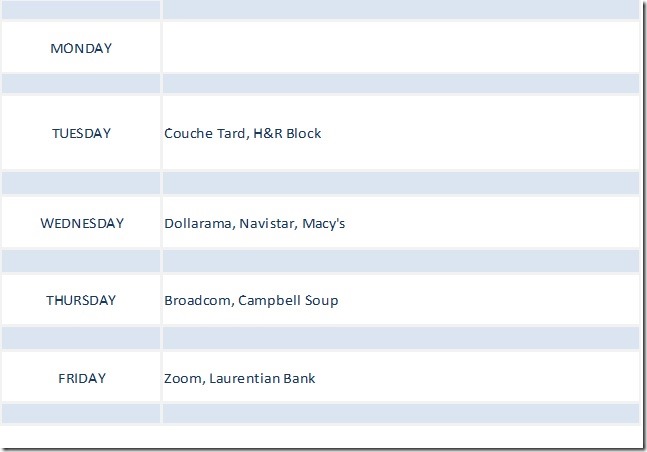
Seven S&P 500 companies are scheduled to release quarterly results this week.
Trader’s Corner
Equity Indices and related ETFs
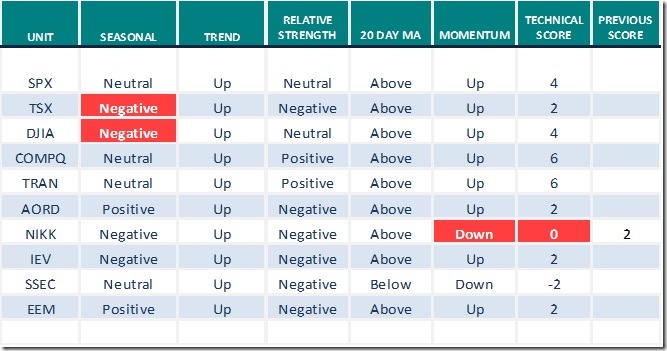
Daily Seasonal/Technical Equity Trends for August 28th 2020
Green: Increase from previous day
Red: Decrease from previous day
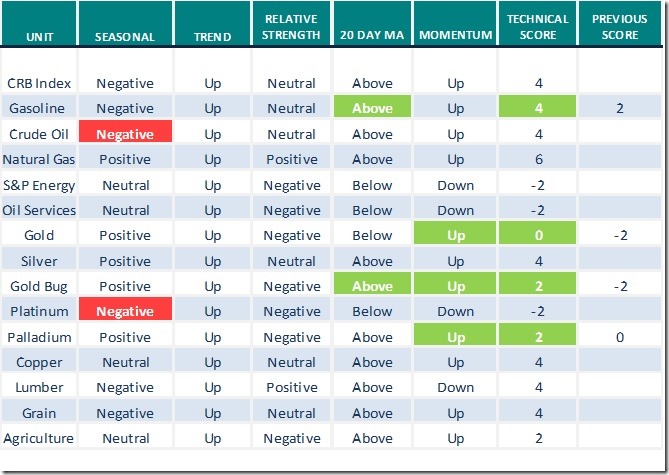
Commodities
Seasonal/Technical Commodities Trends for August 28th 2020
Green: Increase from previous day
Red: Decrease from previous day
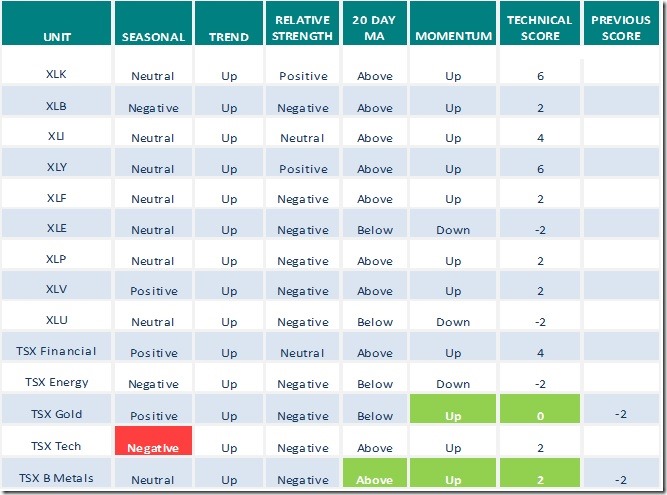
Sectors
Daily Seasonal/Technical Sector Trends for August 28th 2020
Green: Increase from previous day
Red: Decrease from previous day
Technical Scores
Calculated as follows:
Intermediate Uptrend based on at least 20 trading days: Score 2
(Higher highs and higher lows)
Intermediate Neutral trend: Score 0
(Not up or down)
Intermediate Downtrend: Score -2
(Lower highs and lower lows)
Outperformance relative to the S&P 500 Index: Score: 2
Neutral Performance relative to the S&P 500 Index: 0
Underperformance relative to the S&P 500 Index: Score –2
Above 20 day moving average: Score 1
At 20 day moving average: Score: 0
Below 20 day moving average: –1
Up trending momentum indicators (Daily Stochastics, RSI and MACD): 1
Mixed momentum indicators: 0
Down trending momentum indicators: –1
Technical scores range from -6 to +6. Technical buy signals based on the above guidelines start when a security advances to at least 0.0, but preferably 2.0 or higher. Technical sell/short signals start when a security descends to 0, but preferably -2.0 or lower.
Long positions require maintaining a technical score of -2.0 or higher. Conversely, a short position requires maintaining a technical score of +2.0 or lower
Changes Last Week
Technical Notes for August 28th
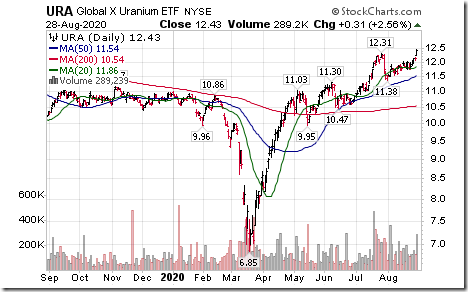
Uranium equity ETF (URA) moved above $12.31 extending an intermediate uptrend.
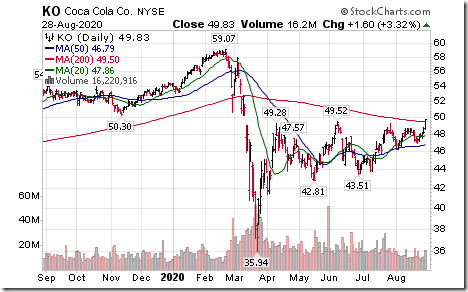
Coca Cola (KO), a Dow Jones Industrial Average moved above $49.52 extending an intermediate uptrend.
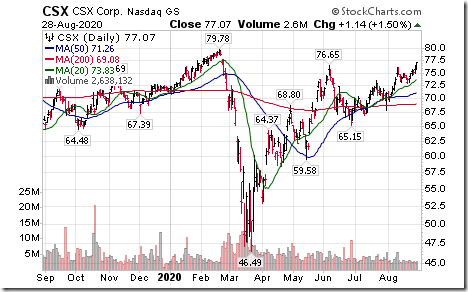
CSX Corp. (CSX), a NASDAQ 100 stock moved above $76.65 extending an intermediate uptrend.
S&P 500 Momentum Barometer
The Barometer gained 3.21% on Friday and 16.26% last week to 82.36. It changed on Friday from intermediate neutral to extremely intermediate overbought on a move above 80.00%
TSX Momentum Barometer
The Barometer added 0.36% on Friday and slipped 0.23% last week to 75.48%. It remains intermediate overbought.
Disclaimer: Seasonality and technical ratings offered in this report and at
www.equityclock.com are for information only. They should not be considered as advice to purchase or to sell mentioned securities. Data offered in this report is believed to be accurate, but is not guaranteed
This post was originally publised at Vialoux's Tech Talk.


