
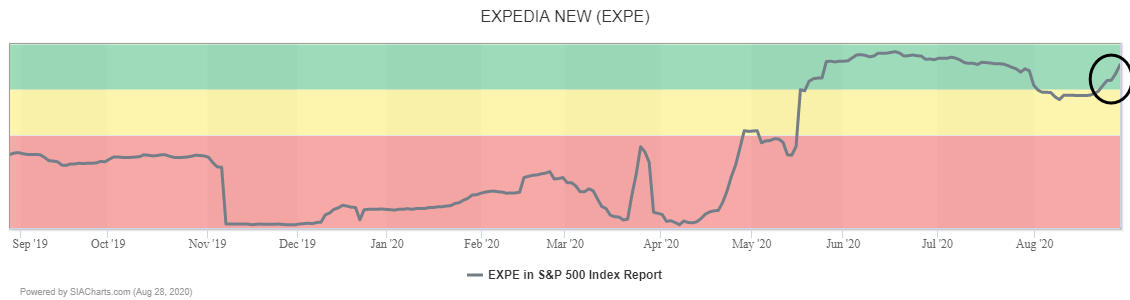
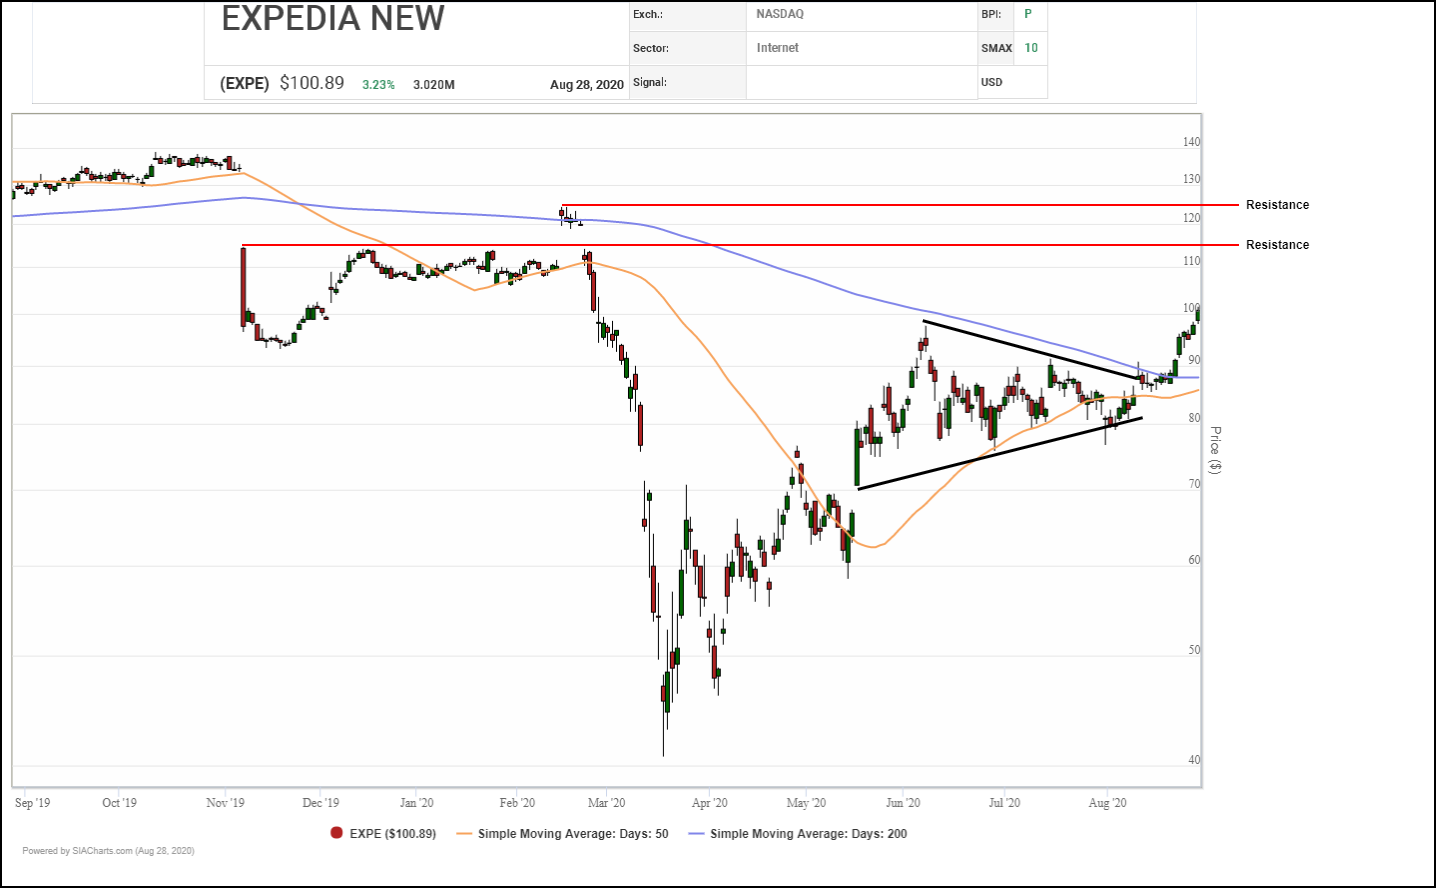
Expedia (EXPE) continues to climb within the Green Favored Zone of the SIA S&P 500 Index Report, moving up another 24 spots on Friday. Earlier this month, Expedia (EXPE) staged a major breakout over $90.00, which resolved a symmetrical consolidation triangle to the upside and signaled the start of a new advance. Since then, the shares have continued to climb, with breakouts over the previous high near $97.50 and the $100.00 round number confirming ongoing accumulation. Next potential resistance on trend appears near $112.50 around previous highs and the bottom of an old gap, then $125.00 where a round number and a prior peak converge. Initial support moves up toward $95.00 from $90.00.
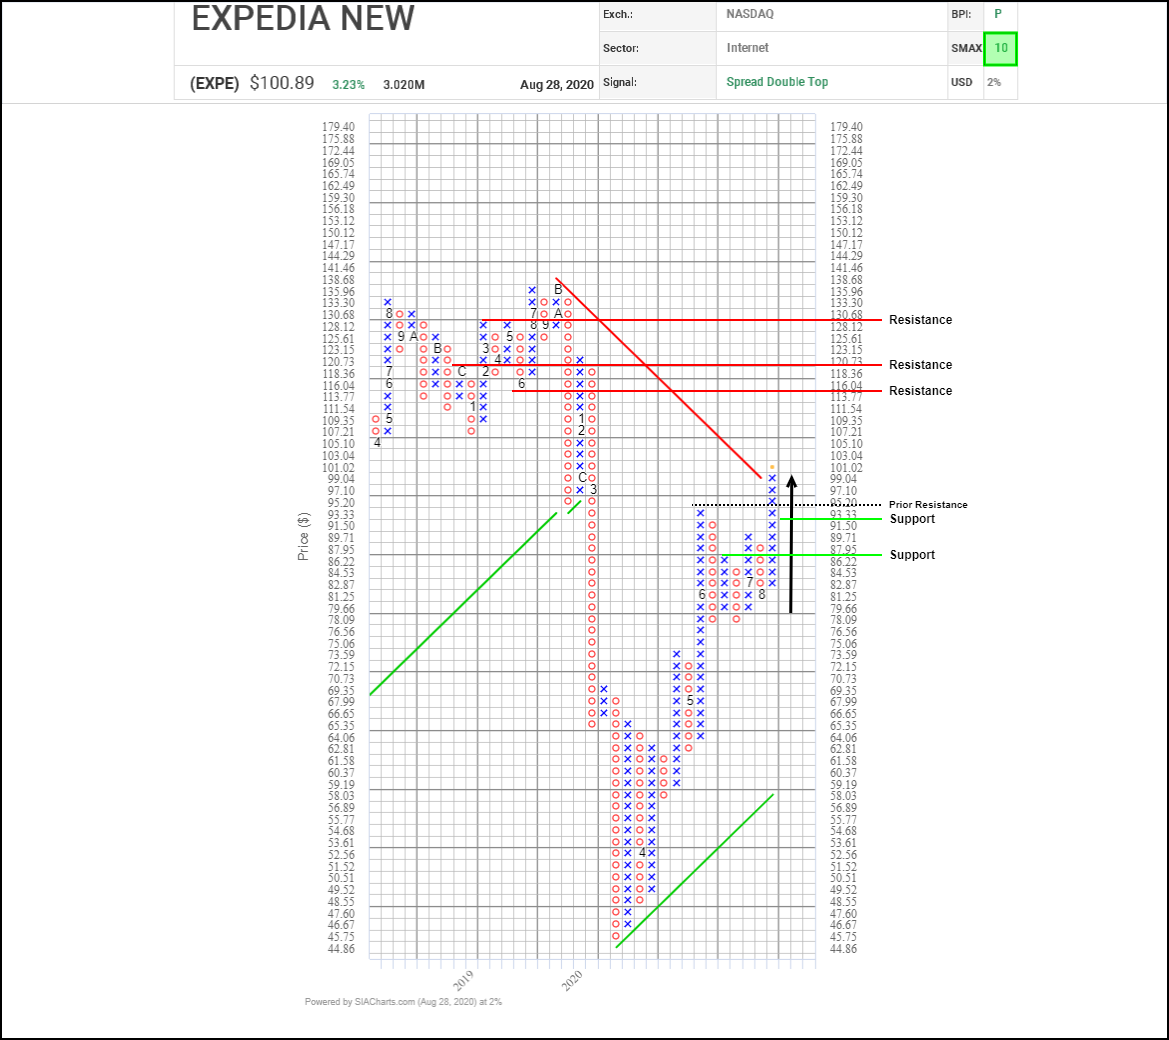
Building on a recent bullish Spread Double Top breakout, Expedia (EXPE) broke through the $100.00 round number barrier and snapped a 45-degree downtrend line, confirming that a new uptrend is underway. Next potential upside resistance appears in the $116.00 to $120.00 range based on vertical and horizontal counts, then the $125.00 round number, and previous column highs near $130.00. Initial support appears near $91.50 based on a 3-box reversal. With a perfect SMAX score of 10, EXPE is exhibiting near-term strength across the asset classes.
Disclaimer: SIACharts Inc. specifically represents that it does not give investment advice or advocate the purchase or sale of any security or investment whatsoever. This information has been prepared without regard to any particular investors investment objectives, financial situation, and needs. None of the information contained in this document constitutes an offer to sell or the solicitation of an offer to buy any security or other investment or an offer to provide investment services of any kind. As such, advisors and their clients should not act on any recommendation (express or implied) or information in this report without obtaining specific advice in relation to their accounts and should not rely on information herein as the primary basis for their investment decisions. Information contained herein is based on data obtained from recognized statistical services, issuer reports or communications, or other sources, believed to be reliable. SIACharts Inc. nor its third party content providers make any representations or warranties or take any responsibility as to the accuracy or completeness of any recommendation or information contained herein and shall not be liable for any errors, inaccuracies or delays in content, or for any actions taken in reliance thereon. Any statements nonfactual in nature constitute only current opinions, which are subject to change without notice.