Daily Stock Report - July 23, 2020 Advanced Micro Devices Inc. - (AMD)

by SIACharts.com

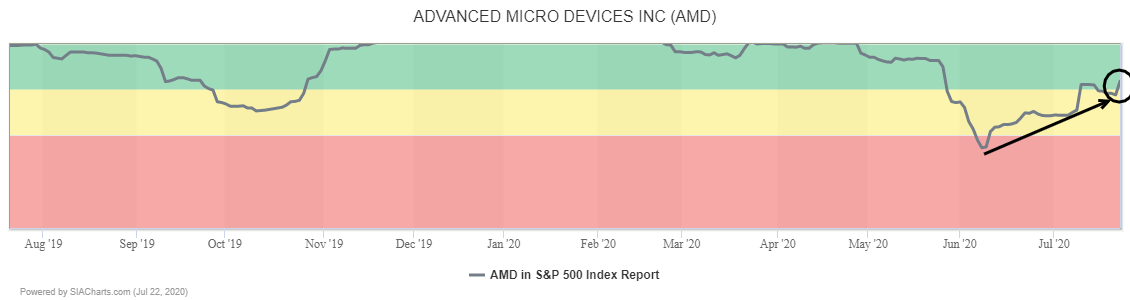
Advanced Micro Devices (AMD) has returned to the Green Favored Zone of the SIA S&P 500 Index Report for the first time since May after climbing 37 spots yesterday.

A major breakout is underway in Advanced Micro Devices (AMD) this week with the shares blasting through the top of a $48.00 to $60.00 trading range to a new all-time high, signaling the start of a new advance. A spike in volume on the breakout confirms increased investor interest Next potential upside resistance tests on trend appear near $66.00 then $72.00 based on measured moves. Initial support moves up toward $58.00 from the 50-day average near $54.00.

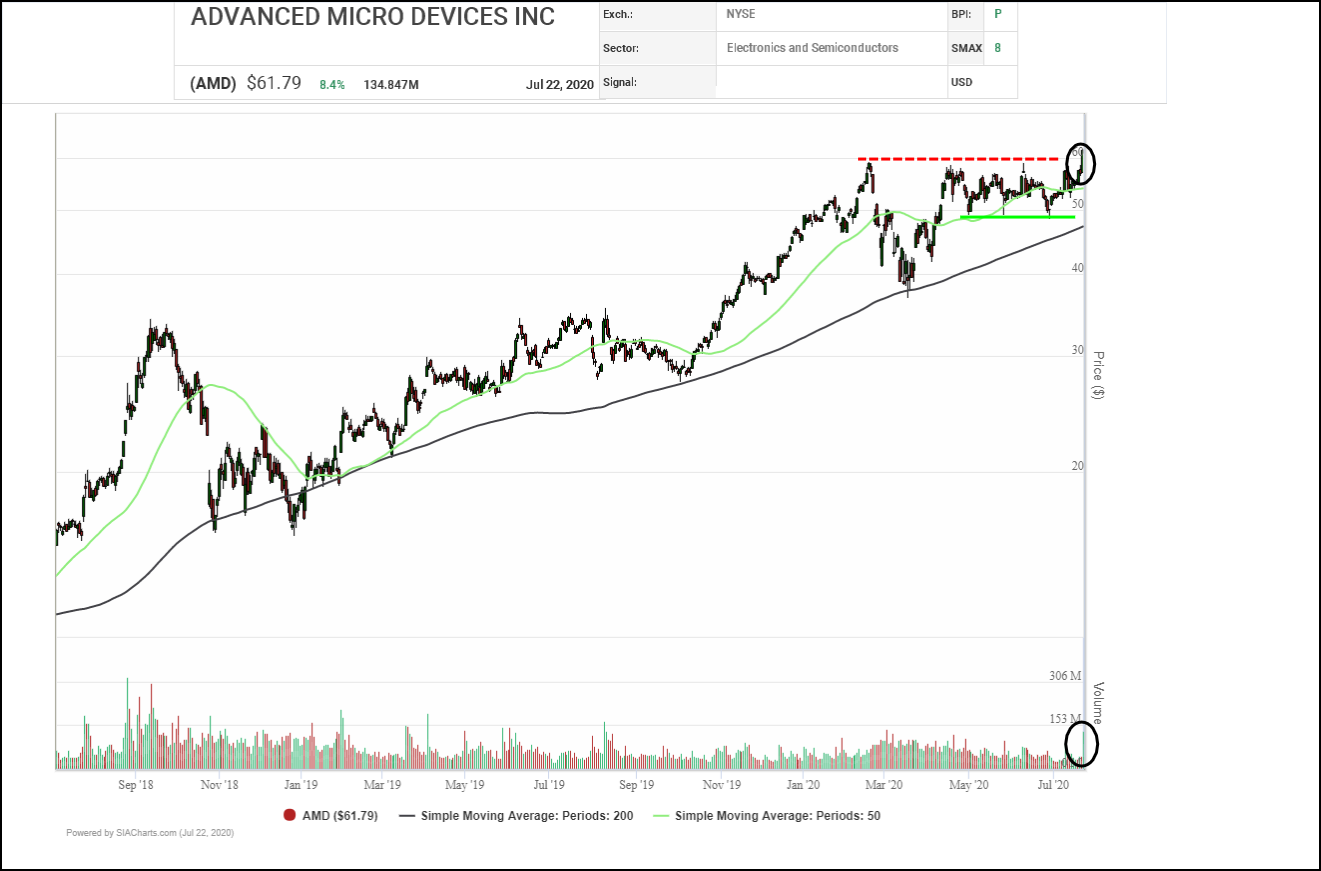
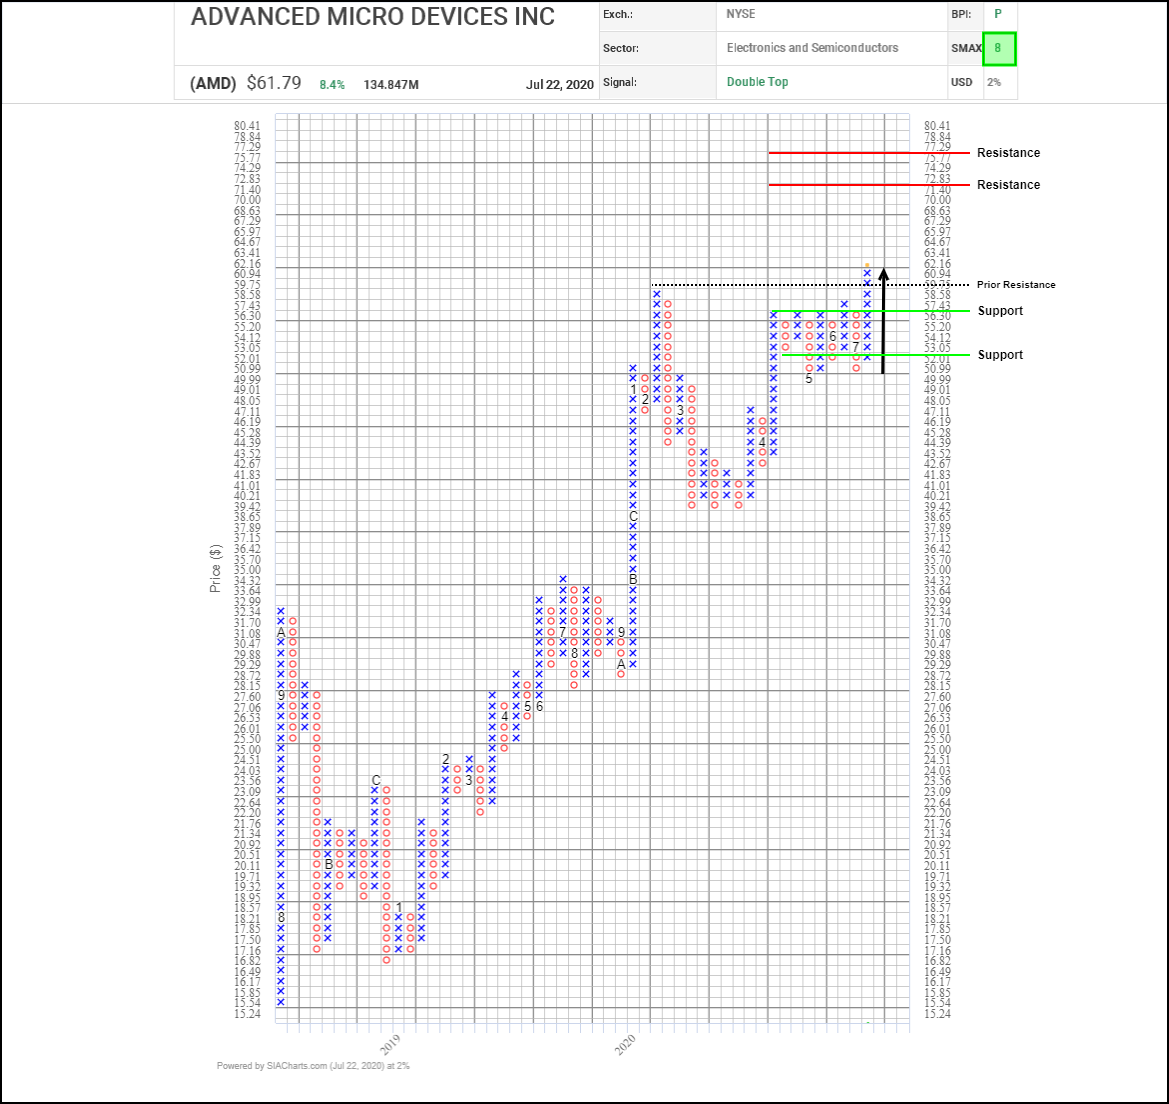
Since completing an initial recovery rally back in March-April, AMD shares have been consolidating in the $49.00 to $57.50 range. Back in June the shares completed a bullish Quadruple Top which fizzled but this week they have attracted renewed interest breaking through $60.00 to a new all-time high. Next potential upside resistance on trend appears in the $72.80 to $77.30 range where several of vertical and horizontal counts cluster. Initial support appears near $56.30 based on a 3-box reversal.

With its bullish SMAX score increasing to 8, AMD is exhibiting near-term strength against the asset classes.

Disclaimer: SIACharts Inc. specifically represents that it does not give investment advice or advocate the purchase or sale of any security or investment whatsoever. This information has been prepared without regard to any particular investors investment objectives, financial situation, and needs. None of the information contained in this document constitutes an offer to sell or the solicitation of an offer to buy any security or other investment or an offer to provide investment services of any kind. As such, advisors and their clients should not act on any recommendation (express or implied) or information in this report without obtaining specific advice in relation to their accounts and should not rely on information herein as the primary basis for their investment decisions. Information contained herein is based on data obtained from recognized statistical services, issuer reports or communications, or other sources, believed to be reliable. SIACharts Inc. nor its third party content providers make any representations or warranties or take any responsibility as to the accuracy or completeness of any recommendation or information contained herein and shall not be liable for any errors, inaccuracies or delays in content, or for any actions taken in reliance thereon. Any statements nonfactual in nature constitute only current opinions, which are subject to change without notice.
Total
0
Shares
Previous Article

Answers to pressing questions from investors

Next Article

Stock Market Reaction to Expiring COVID-19 Programs

Related Posts
Subscribe to AdvisorAnalyst.com notifications
Watch. Listen. Read. Raise your average.