
by Talley Léger Sr. Investment Strategist, Invesco Canada, Invesco Canada
We were joined recently by clients for a discussion about global investment opportunities, in the context of technically overbought conditions in US stocks. In this blog, we share our views regarding where we see risks and opportunities in international stocks.
From a valuation perspective, in which regions and countries do you see the most risk and opportunity? Where do the US and Canada fit into that valuation spectrum?
Following a high-velocity selloff and subsequent v-shaped rebound, US stocks have surprisingly clung to their status as one of – if not the most – overvalued market segments of the developed world. Indeed, US and developed market price-to-sales (P/S) ratios are trading at notable premia relative to the global benchmark and history. In our view, unprecedented policy support has encouraged extreme risk-taking by investors, the consequence of which has been frothy valuations in US stocks.
At the other end of the valuation spectrum, structural underperformance from Chinese and emerging market (EM) stocks – until recently – has compressed their P/S ratios to deep discounts compared to the world index and history. Clearly, Europe and Canada are developed economic regions. However, European and Canadian stocks trade at discounts like those of Chinese and EM stocks.
While valuations are a good starting point for an investment thesis, they’re not enough on their own. Indeed, cheap valuations require catalysts to unleash the potential opportunities embedded in share prices. On that score, leading indicators of business activity across the emerging world – China and South Korea in particular – have been proving more resilient than those of the developed world, including the US, Europe, Japan and Canada.
We believe compelling opportunities exist for investors in EM stocks at a time when many emerging economies – especially Asia excluding Japan – are recovering from the virus-related “sudden stop” in activity. Attractive valuations and improving economic growth could be a powerful combination for unlocking the potential rewards presented by EM stocks and so far, they appear to be working.
Figures 1 and 2. Not all regions and countries are made equal. For selectivity, consider targeting low valuations and faster growth over high valuations and slower growth both across and within regions.
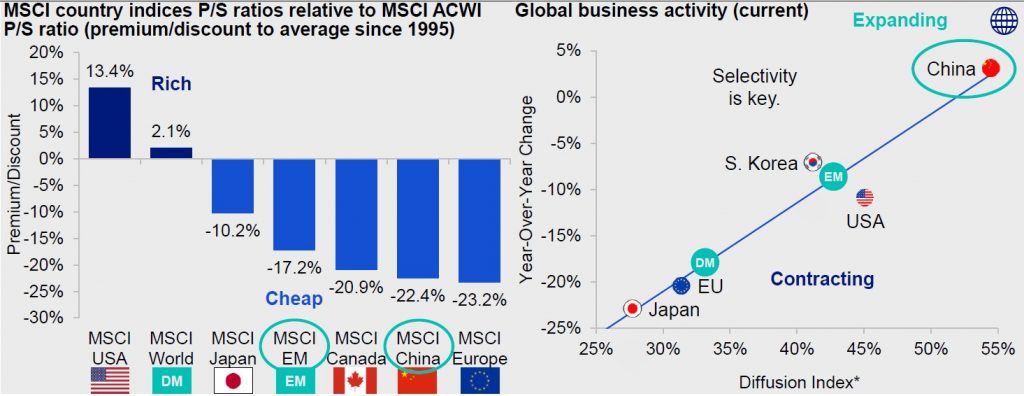
Source: Bloomberg L.P., Haver, Invesco, 07/01/20. Notes: P/S = Price-to-sales ratio. Ranked from left to right—from highest premium to lowest discount. ACWI = All Country World Index. EU = European Union. EU Excluding UK Composite PMI = France, Germany, Ireland, Italy and Spain. Diffusion indices have the properties of leading indicators, and are convenient summary measures showing the prevailing direction and scope of change.* An investment cannot be made in an index. Past performance does not guarantee future results.
US companies are highly exposed to international markets. Don’t US stocks provide investors with enough international diversification?
Contrary to popular belief, US companies aren’t the most globally exposed. In fact, they have the lowest international exposure – capturing 39% of total revenues – of all the major developed markets that we follow. Some may be surprised to learn that French companies’ international revenues represent a whopping 82% of their total revenues!
Admittedly, it’s difficult to determine how much international exposure an investor should have without knowing several things about them, including their risk tolerance, goals, life stage, and planned retirement date.
That said, there’s a simple way of assessing whether you own enough international stocks. In our view, the weight of the MSCI USA Index in the MSCI All Country World Index (ACWI) is a good starting point for benchmarking your international diversification. US stocks capture 58% of the global equity benchmark, which means that non-US stocks capture 42% of the worldwide stock market.
Many investors are surprised to learn that non-US equities represent almost half of a passively indexed global equity portfolios. Moreover, what they thought was a generous allocation to international stocks – typically 25% – is far below the planetary benchmark.
As aggressive as it may seem, the reality is that setting international equity allocations equal to their weight in the global benchmark would express a neutral stance on the asset class.
Figures 3 and 4. US companies have the lowest international exposure of all the major developed markets
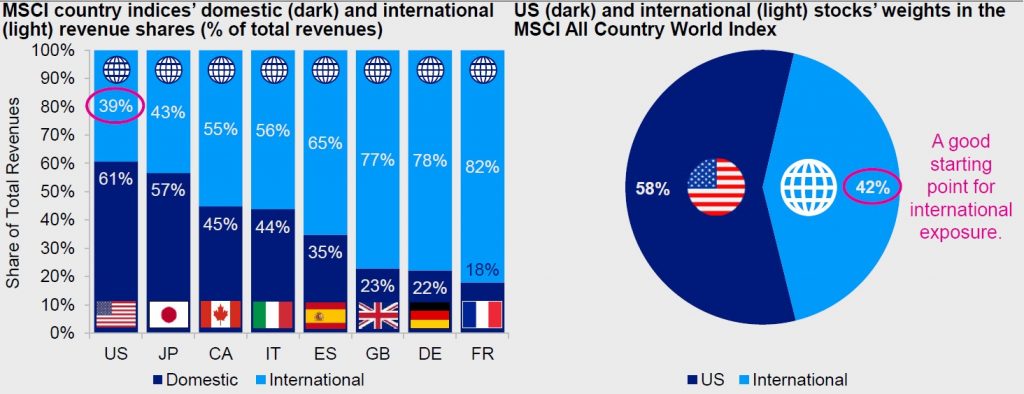
Source: FactSet, Invesco, 07/17/20. Notes: An investment cannot be made in an index. Past performance does not guarantee future results.
Looking back, what was the cost of the shutdown, and how might it have impacted second-quarter S&P 500 earnings?
While it may seem like a daunting task to quantify the earnings impact of COVID-19 and the related cost of the shutdown, we think it’s possible.
First, we need a baseline for 2Q20 S&P 500 trailing 12-month operating earnings per share (EPS), which we assume to be $121. Next, we require a weekly earnings number ($121/52 = $2.32).
Then, we must guess how many companies were shut down. Obviously, not all companies were idle during the virus-related shutdown. In fact, some firms benefitted tremendously in the heath care, consumer staples, technology and communications sectors. We naively assume half of the firms were idle ($2.32/2 = $1.16).
For the final step, we erode the baseline by the lost earnings of those companies over a 12-week shutdown ($1.16*12 = $14). In other words, we suspect 2Q20 S&P 500 earnings may have been $14 lower than analysts believe, which would equate to $107 or a 31% decline from year-ago levels.
Figures 5. We suspect 2Q20 S&P 500 earnings may have been $14 lower than analysts believe
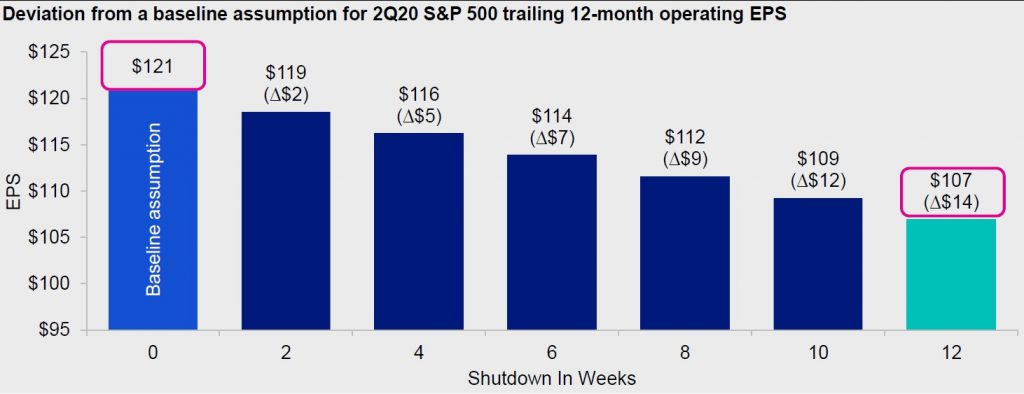
Source: Standard & Poor’s, Invesco, 07/17/20. Notes: Operating earnings per share = Income from product (goods and services), excluding corporate (M&A, financing and layoffs) and unusual items, divided by total shares outstanding. Earnings are priced in US dollars. An investment cannot be made in an index.
While this approach is simplistic, it’s worth noting 1Q20 S&P 500 operating EPS settled at $139 or -9% year-over-year, just $3 below our simulation of $142 or -7% year-over-over. As we anticipated, it seems a broad market earnings recession began in 1Q20, which we expect to be followed by much deeper decreases in coming quarters.
Despite the popularity of earnings, we underscore that they’re quarterly, lagging variables whereas stocks are real-time financial market variables and leading economic indicators that get ahead of fundamentals by a good three to six months. Said differently, scrutinizing second-quarter earnings—when we’re already in the third quarter—is akin to driving a car backwards while looking in the rearview mirror.
Where do you see materials and commodities going during these COVID-19 times?
We expect materials stocks to outperform the broader market, given synchronized central bank support. For example, the Federal Reserve (Fed) has embarked on a seemingly open-ended commitment to continue buying securities until the economic and labor market outlooks improve substantially.
An important consequence of the Fed’s unprecedented balance sheet expansion is the weakness of the US dollar, which should reinforce the blossoming rally in cyclical stocks through foreign exposure/sales, Rest of the World (RoW) profits, positive translation effects and increased competitiveness. In other words, US goods and services become cheaper when the currency depreciates.
If quantitative easing (QE) represents a choice between interest rates and the US dollar, the Fed has opted to save growth and jobs by loosening the monetary screws and inflating the money supply at the expense of the currency. From that perspective, it’s reasonable to expect the US dollar to weaken further if the Fed keeps such an abundant supply of currency in circulation.
In turn, the US dollar is inversely related to the relative performance of the materials sector, the fundamental link being foreign exposure. According to Standard & Poor’s, materials companies relied on foreigners for 57% of their total sales in 2018, second only to information technology at 58%.
US dollar weakness helps US-based materials companies to be more competitive on the world economic stage. Dollar depreciation augments the value of foreign sales (denominated in strengthening currencies) when they’re translated to the home currency.
The flipside of US dollar weakness is commodity price strength. Indeed, early-stage commodities have been on an upward track, supporting a positive view of the materials sector. Commodity prices—barometers of materials companies’ input and/or output prices—are key drivers of materials stocks. The CRB BLS Raw Industrials Sub-Index is a good gauge of basic commodities close to the early stages of the production process. As such, they’re among the first to respond to changes in global economic activity.
Our positive view of materials stocks depends on whether the global economic recovery gathers pace. Should the economy suffer a relapse, it would likely be difficult for materials stocks to continue outperforming. If the US dollar keeps weakening alongside forceful blasts of QE from the major central banks, materials stocks should continue to benefit. Indeed, standing in the way of size buyers like the Fed has been an unprofitable strategy in the past.
Figures 6 and 7. The flipside of policy-induced currency weakness is commodities and materials strength.
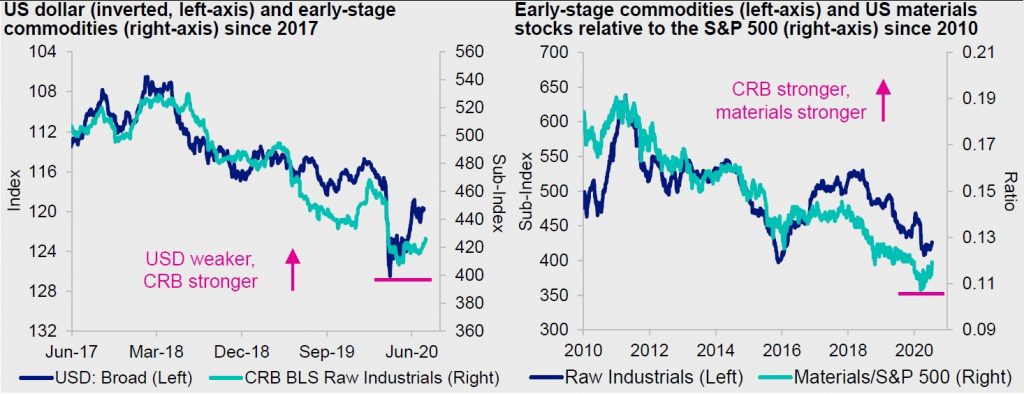
Source: Bloomberg L.P., Invesco, 07/17/20. Notes: USD = US dollar. The broad currency index is a weighted average of the foreign exchange value of the US dollar against the currencies of a broad group of major US trading partners. CRB = Commodity Research Bureau. BLS = Bureau of Labor Statistics. The CRB BLS Raw Industrials Sub-Index measures the prices of burlap, copper scrap, cotton, hides, lead scrap, print cloth, rosin, rubber, steel scrap, tallow, tin, wool tops and zinc. An investment cannot be made in an index. Commodities and stocks are priced in USD. Past performance does not guarantee future results.
This post was first published at the official blog of Invesco Canada.