by Don Vialoux, EquityClock.com
The Bottom Line
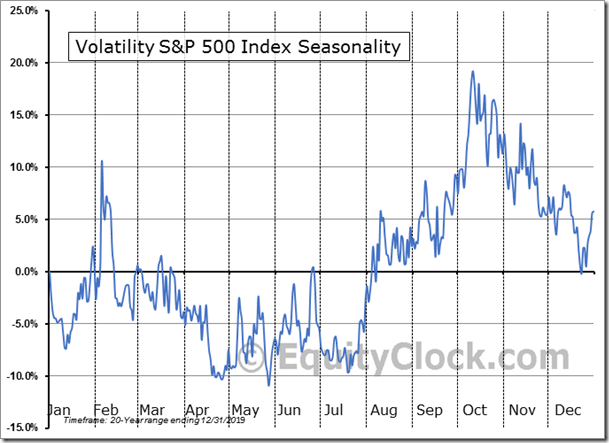
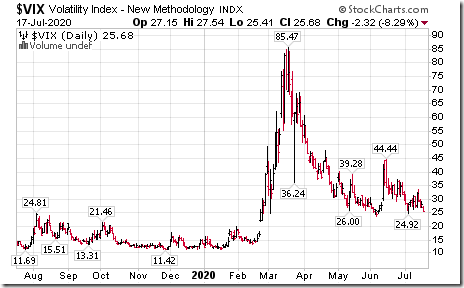
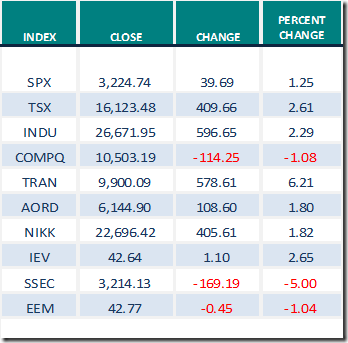
Most equity indices around the world moved higher last week, Exceptions were Far East indices, notably Chinese indices. Selected indices managed to move above their June 8th high during their typical summer rally period from late June to the third week in July (e.g.TSX Composite, DAX, S&P 500). Others tried, but failed (e.g Dow Jones Industrial Average, Nikkei, Dow Jones Transportation Average, Russell 2000). In addition, the NASDAQ Composite Index moved lower. Major influences continue to be concern about a second wave of the coronavirus (negative) and possibility of approval of a vaccine by early November (positive). Technical indicators for North American equity markets remain intermediate overbought and past their peak. The VIX Index remains elevated and typically moves higher from now to early October. Look for volatile, choppy markets between now and October that lack a trend.
Observations
The VIX Index (better known as the Fear Index) remained elevated last week.
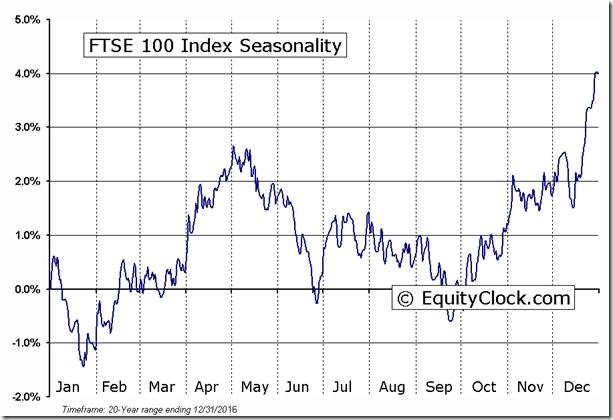
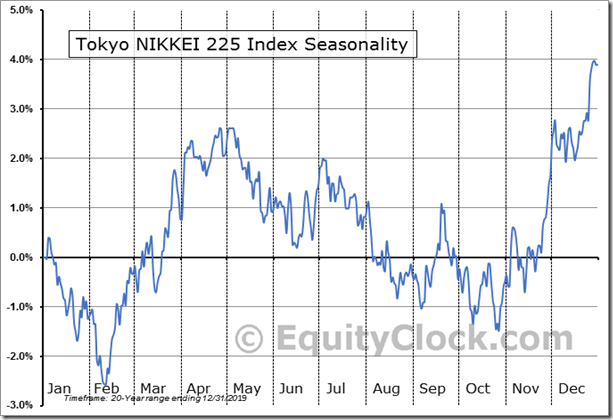
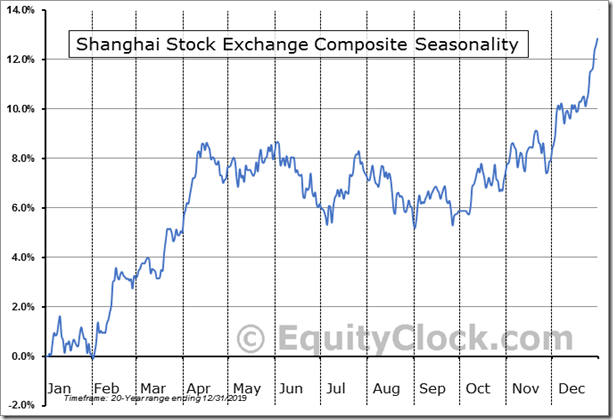
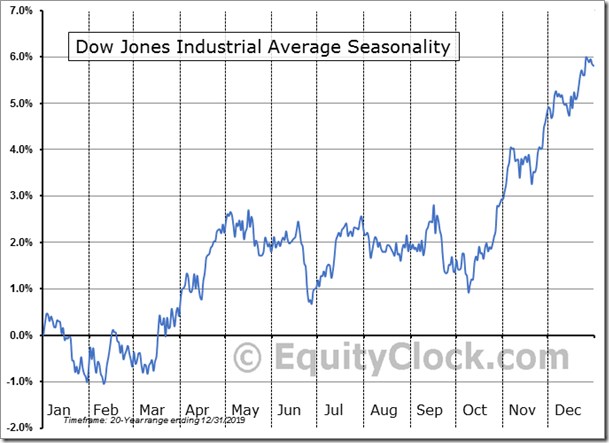
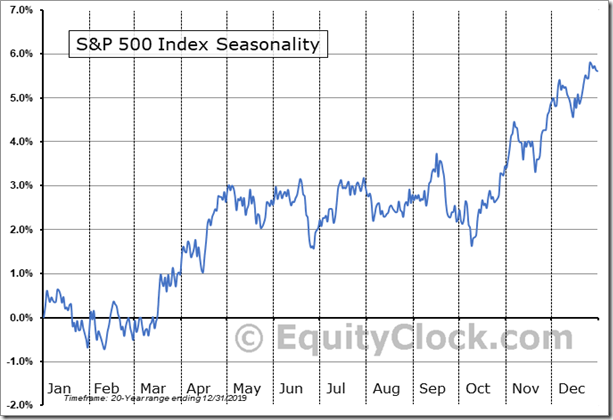
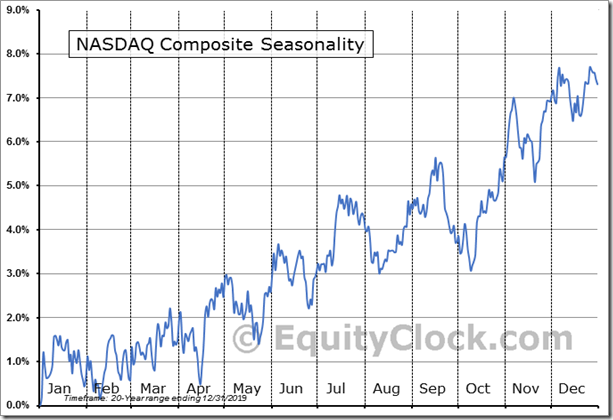
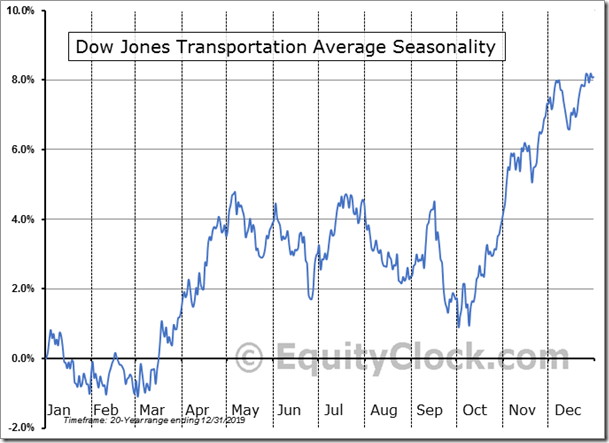
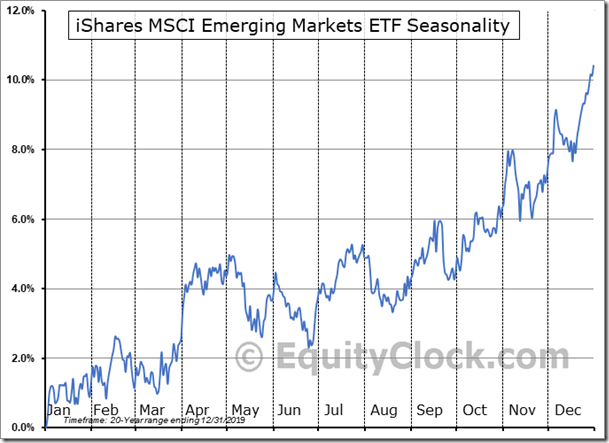
Historically, many equity indices reach an intermediate peak in mid-July (+ or – two weeks) based on seasonal trends during the next 2-3 months.
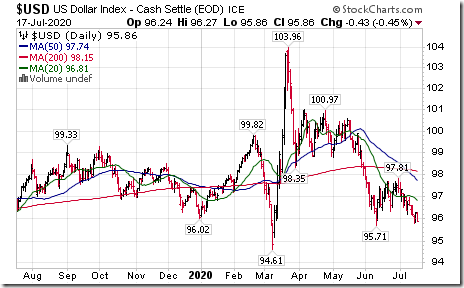
Weakness in the U.S. Dollar is having an impact. On Friday, the U.S. Dollar Index fell 0.43 to a four month closing low at 95.85.
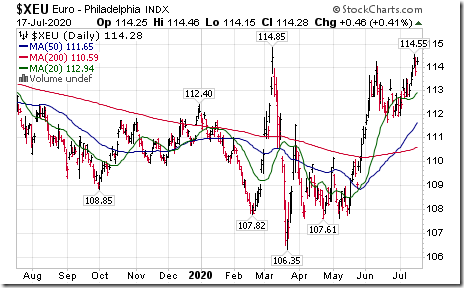
Conversely, the Euro advanced 0.46 to 114.28 on Friday to a four month high.
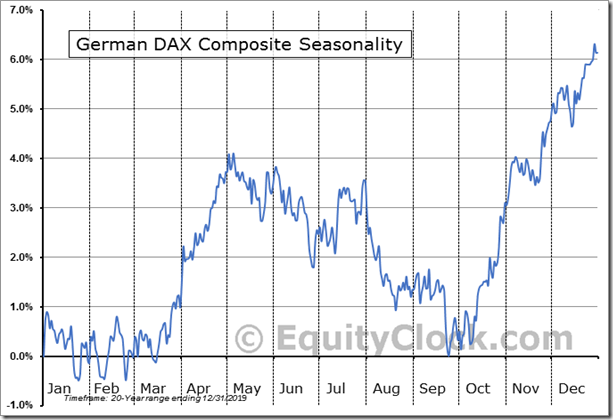
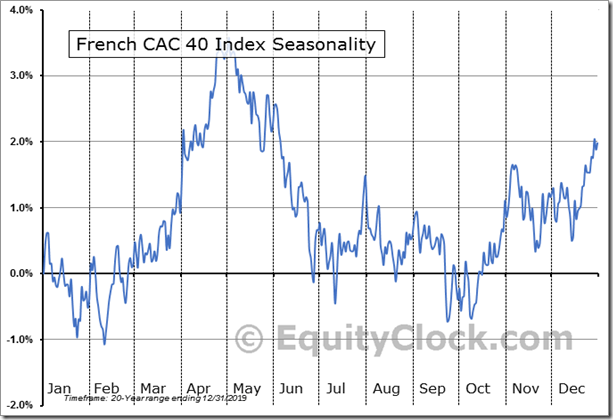
U.S. Dollar weakness has prompted higher commodity prices and higher inflation expectations in the U.S. Weakness in the U.S. Dollar implies a slowdown in the recovery in U.S. economic growth recorded during the past three months and corresponding lower expectation for third quarter revenues and earnings by domestic operations of U.S. corporations. Not surprising, fund flows into equity markets have started to move from the U.S. (particularly from the Russell 2000 Index) to other markets, notably Europe.
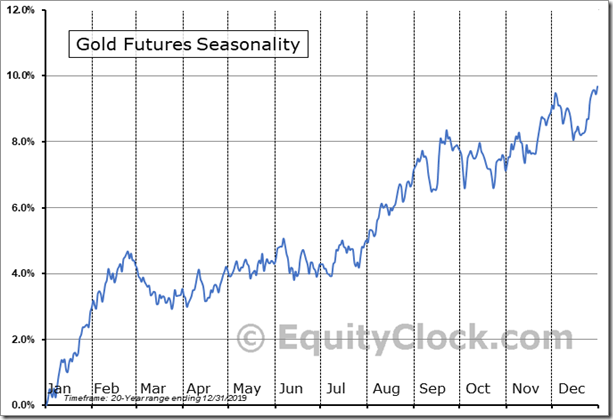
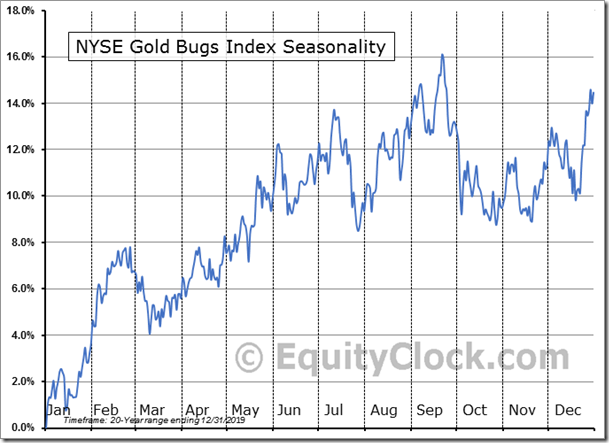
A weak U.S. Dollar has prompted strength in gold, gold equities and related ETFs. Both are just entering their best annual period of seasonal strength from the third week in July to late September.
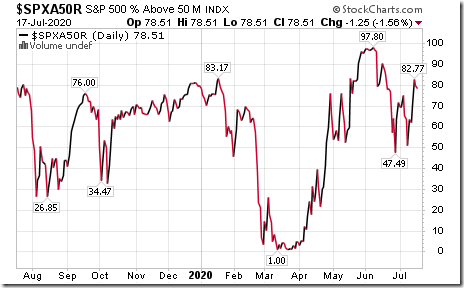
Medium term technical indicators for U.S. equity markets (e.g. Percent of S&P 500 stocks trading above their 50 day moving average) remained overbought last week, but are below their intermediate peak set on June 8th. See Barometer chart at the end of this report.
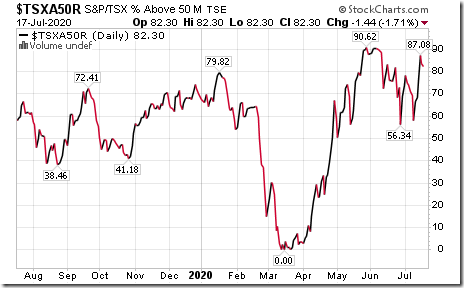
Medium term technical indicators for Canadian equity markets changed back last week from overbought to extremely overbought on a move above 80.00%, but are below their intermediate peak set on June 8th. See Barometer chart at the end of this report.
Most short term short term momentum indicators for U.S. markets and sectors (20 day moving averages, short term momentum indicators) were virtually unchanged last week.
Short term momentum indicators for Canadian markets/sectors increased slightly last week.
Year-over-year consensus earnings for S&P 500 companies in 2020 moved slightly higher last week. Nine percent of companies have reported second quarter results to date with 73% reporting higher than consensus earnings. According to FactSet, second quarter 2020 earnings are expected to fall 44.0% (versus a drop of 44.6% last week) and revenues are expected to drop 10.5% (versus 10.8% last week). Third quarter earnings are expected to fall 24.4% (versus 24.9% last week) and revenues are expected to decrease 5.4%. Fourth quarter earnings are expected to drop 12.4% and revenues are expected to decline 1.8%. Earnings for all of 2020 are expected to decrease 21.1% (versus 21.5% last week) and revenues are expected to decline 2.8% (versus 3.8% last week).
Summer rally this year? The summer rally happened on schedule this year. North American equity markets have a history of moving higher from the last week in June to the third week in July in anticipation of strong and improving second quarter corporate results. However, favourable anticipation of second quarter corporate results for the current year will be given a real test this week when second quarter reports appear in greater volume. Second quarter earnings for all S&P 500 companies are expected to drop 44.0%. Second quarter earnings by TSX 60 companies are expected to drop 20.5%. The summer rally this year probably ending last week.
Consensus estimates for earnings and revenues by S&P 500 companies turn positive on a year-over-year basis in the first quarter of 2021, albeit at a slightly lower rate than previous. According to FactSet, earnings in the first quarter are expected to increase 12.1% (versus 13.0% last week) and revenues are expected to increase 2.8% (versus 2.9% last week). Earnings for all of 2021 are expected to increase 28.0% (versus 28.7% last week) and revenues are expected to increase 8.4% (versus 8.5% last week).
A weak U.S. Dollar has prompted strength in gold, gold equities and related ETFs. Both are just entering their best annual period of seasonal strength from the third week in July to late September.
Economic news this week
Canadian May Retail Sales to be released at 8:30 AM EDT on Tuesday are expected to drop 21.0% versus a decline of 26.4% in April. Excluding auto sales, Canadian May Retail Sales are expected to drop 13.5% versus a decline of 22.0% in April.
June Canadian Consumer Price Index to be released at 8:30 AM EDT on Wednesday is expected to increase 0.4% versus a gain of 0.3% in May.
June U.S. existing Home Sales to be released at 10:00 AM EDT on Wednesday are expected to increase to 4.79 million units from 3.91 million units in May.
June U.S. New Home Sales to be released at 10:00 AM EDT on Friday are expected to increase to 700,000d from 676,000 in May.
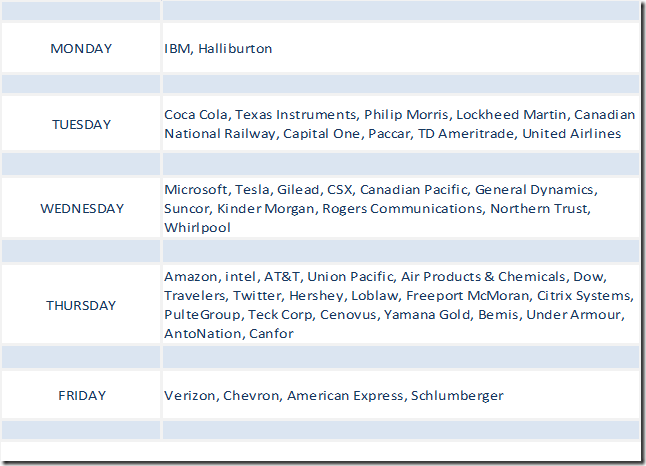
Selected earnings news this week
Trader’s Corner
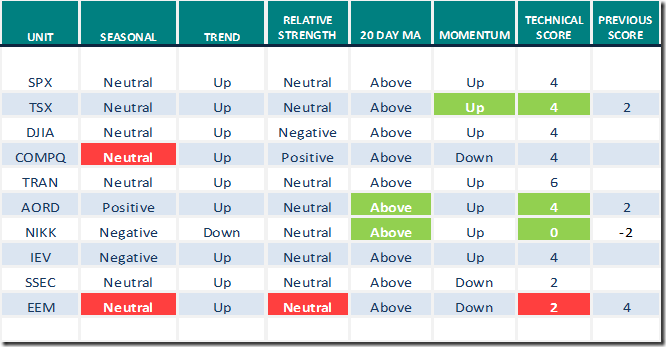
Equity Indices and related ETFs
Daily Seasonal/Technical Equity Trends for July 17th 2020
Green: Increase from previous day
Red: Decrease from previous day
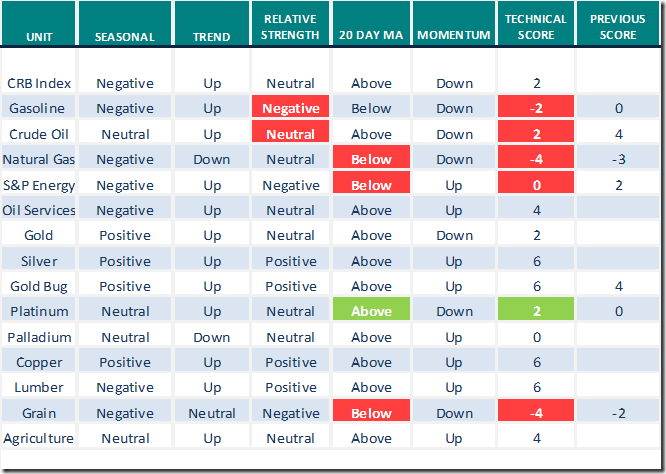
Commodities
Seasonal/Technical Commodities Trends for July 17th 2020
Green: Increase from previous day
Red: Decrease from previous day
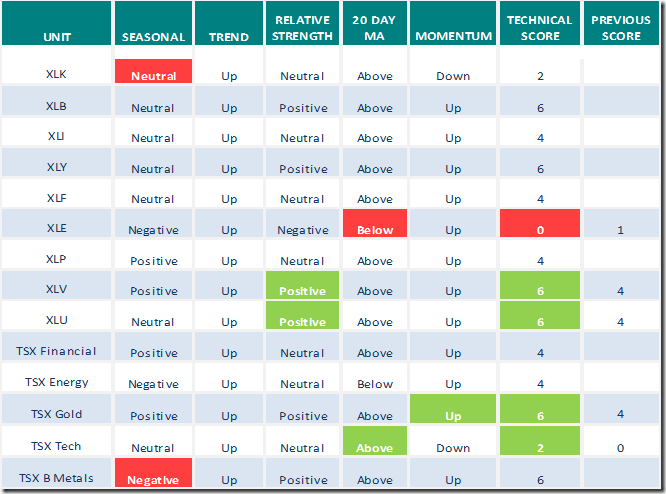
Sectors
Daily Seasonal/Technical Sector Trends for July 17th 2020
Green: Increase from previous day
Red: Decrease from previous day
Technical Scores
Calculated as follows:
Intermediate Uptrend based on at least 20 trading days: Score 2
(Higher highs and higher lows)
Intermediate Neutral trend: Score 0
(Not up or down)
Intermediate Downtrend: Score -2
(Lower highs and lower lows)
Outperformance relative to the S&P 500 Index: Score: 2
Neutral Performance relative to the S&P 500 Index: 0
Underperformance relative to the S&P 500 Index: Score –2
Above 20 day moving average: Score 1
At 20 day moving average: Score: 0
Below 20 day moving average: –1
Up trending momentum indicators (Daily Stochastics, RSI and MACD): 1
Mixed momentum indicators: 0
Down trending momentum indicators: –1
Technical scores range from -6 to +6. Technical buy signals based on the above guidelines start when a security advances to at least 0.0, but preferably 2.0 or higher. Technical sell/short signals start when a security descends to 0, but preferably -2.0 or lower.
Long positions require maintaining a technical score of -2.0 or higher. Conversely, a short position requires maintaining a technical score of +2.0 or lower
Changes Last Week
Technical Notes
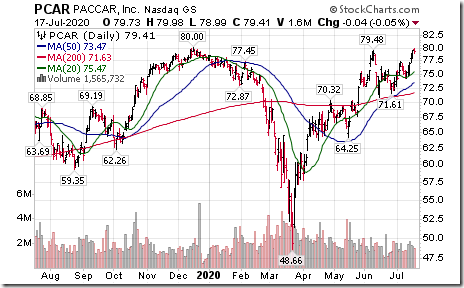
Paccar (PCAR), a NASDAQ 100 stock moved above $79.48 extending an intermediate uptrend.
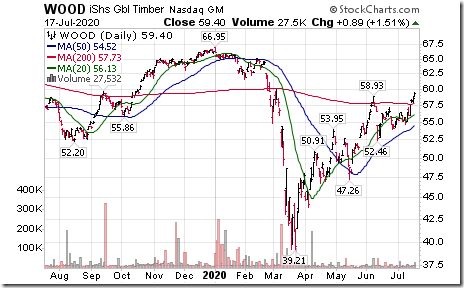
Global Timber iShares (WOOD) moved above $58.93 extending an intermediate uptrend.
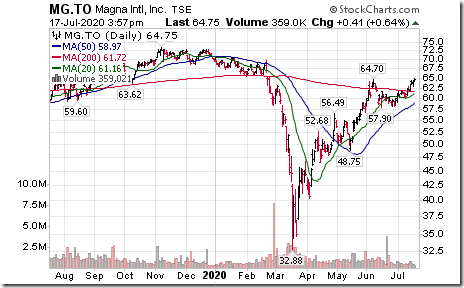
Magna International (MG), a TSX 60 stock moved above Cdn$64.70 extending an intermediate uptrend.
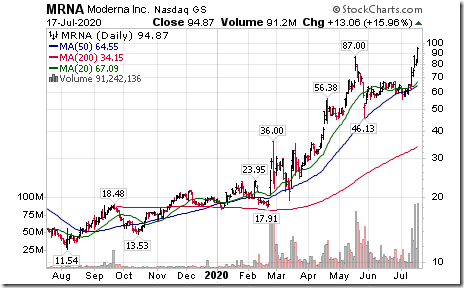
Moderna (MRNA), a NASDAQ Composite stock moved above $87.00 to an all-time high extending an intermediate uptrend. Closing in on a coronavirus vaccine!
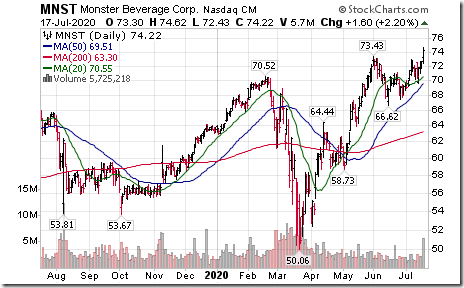
Monster Beverages (MNST), a NASDAQ 100 stock moved above $73.43 to an all-time high extending an intermediate uptrend.
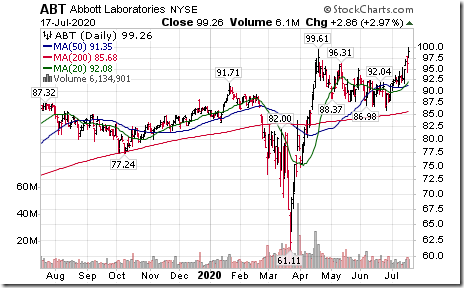
Abbott Labs (ABT), an S&P 100 stock moved above $99.61 to an all-time high extending an intermediate uptrend.
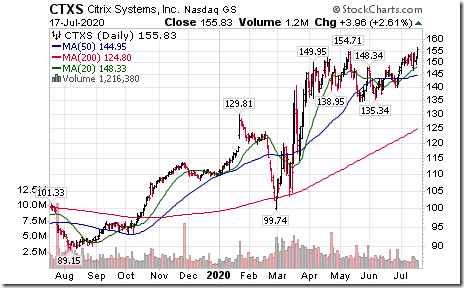
Citrix Systems (CTXS), a NASDAQ 100 stock moved above $154.71 to an all-time high extending an intermediate uptrend.
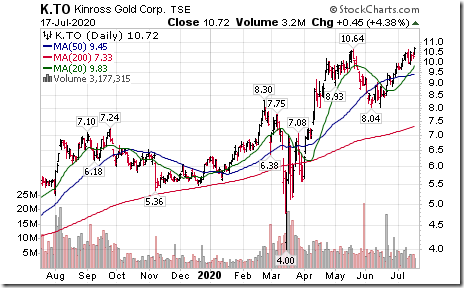
Kinross Gold (K), a TSX 60 stock moved above Cdn.$10.64 to an 8 year high extending an intermediate uptrend.
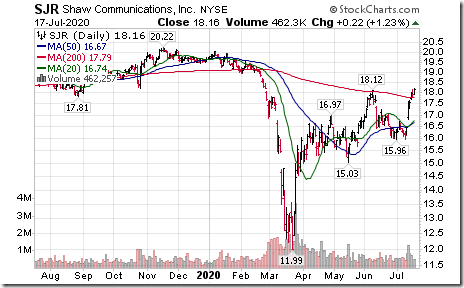
Shaw Communications (SJR SJR.B), a TSX 60 stock moved above US$18.12 extending an intermediate uptrend.
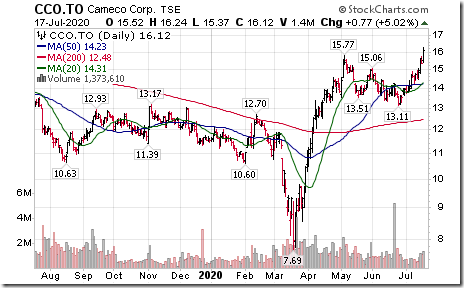
Cameco (CCJ CCO), a TSX 60 stock moved above Cdn$15.17 extending an intermediate uptrend.
S&P 500 Momentum Barometer
The Barometer rose from 63.53 to 78.51 last week. It remains intermediate overbought.
TSX Momentum Barometer
The Barometer advanced from 66.82 to 82.30 last week. It changed from intermediate overbought to extremely intermediate overbought on a move above 80.00.
Disclaimer: Seasonality and technical ratings offered in this report and at
www.equityclock.com are for information only. They should not be considered as advice to purchase or to sell mentioned securities. Data offered in this report is believed to be accurate, but is not guaranteed
This post was originally publised at Vialoux's Tech Talk.


