by Don Vialoux, EquityClock.com
Pre-opening Comments for Monday July 6th
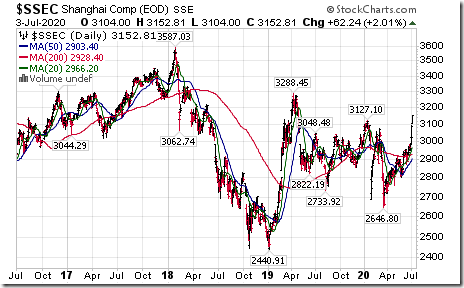
U.S. equity index futures were higher this morning. S&P 500 futures were up 40 points in pre-opening trade. Index futures were spurred by overnight strength in international equity markets. The Shanghai Composite Index was notably stronger, up 5.71% to a 30 month high of 3,332.88.
Tesla added $69.34 to $1,275.41 after Deutsche Bank raised its target price from $900 to $1000.
Harley Davidson (HOG $23.44) is expected to open higher after Citigroup initiated coverage with a Buy rating
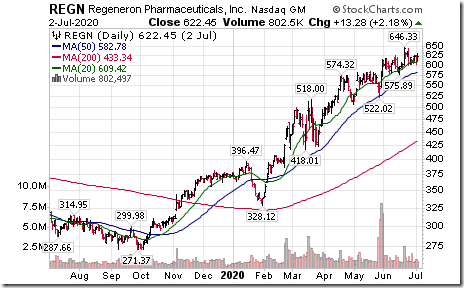
Regeneron (REGN 622.45) is expected to open higher after the company launched a Phase 3 trial for a COVID 19 antibody treatment.
EquityClock’s Daily Market Comment
Following is a link:
http://www.equityclock.com/2020/07/02/stock-market-outlook-for-july-6-2020/
Note seasonality chart on U.S. Non-farm Payrolls.
The Bottom Line
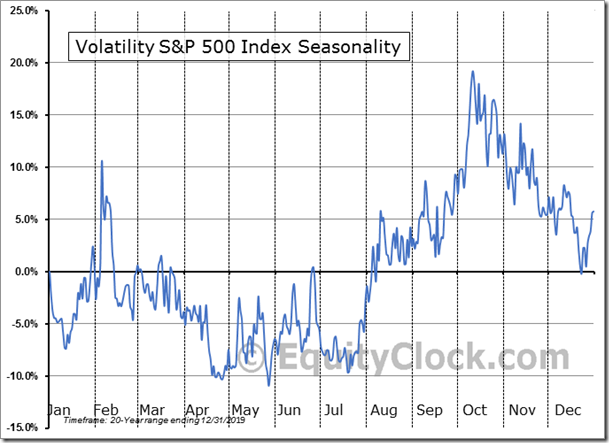
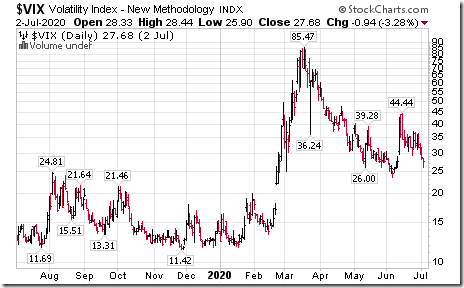
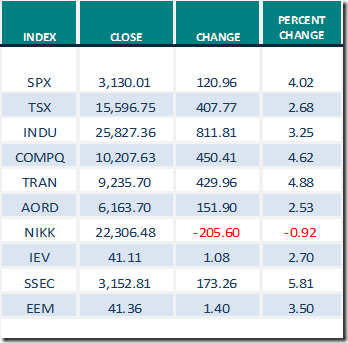
Most equity indices in the world mostly moved higher last week. However, indices in Europe and North America remain below their peak reached on or about June 9th. Concern about a second wave of the coronavirus (negative) and possibility of FDA approval of a vaccine by early November (positive) continue to influence equity prices. Technical indicators for North American equity markets returned from neutral to intermediate overbought levels last week. The VIX Index remains elevated, typical for North American equity markets between late-May and mid-October.
Observations
The VIX Index (better known as the Fear Index) remained elevated last week.
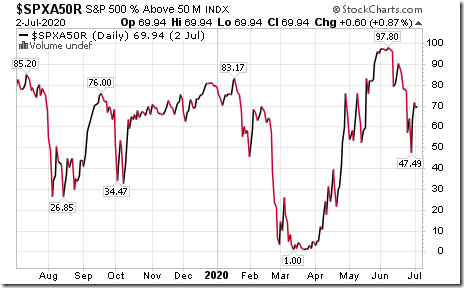
Medium term technical indicators for U.S. equity markets (e.g. Percent of S&P 500 stocks trading above their 50 day moving average) turned back from neutral to over bought last week. See Barometer chart at the end of this report.
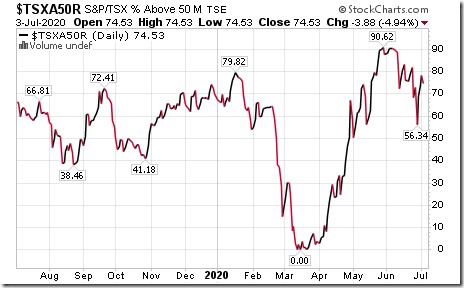
Medium term technical indicators for Canadian equity markets also turned back from neutral to over bought last week. See Barometer chart at the end of this report.
Most short term short term momentum indicators for U.S. markets and sectors (20 day moving averages, short term momentum indicators) moved higher last week.
Short term momentum indicators for Canadian markets and sectors also moved higher last week.
Year-over-year consensus earnings for S&P 500 companies moved very slightly higher last week. According to FactSet, second quarter 2020 earnings are expected to fall 43.8% (versus a drop of 43.9% last week) and revenues are expected to drop 11.1% (versus 11.2% last week). Third quarter earnings are expected to fall 25.2% (versus 25.4% last week) and revenues are expected to decrease 5.5% (versus 5.6% last week). Fourth quarter earnings are expected to drop 12.7% (versus 12.8% last week) and revenues are expected to decline 1.7%. Earnings for all of 2020 are expected to decrease 21.5% (versus 21.6% last week) and revenues are expected to decline 3.9%.
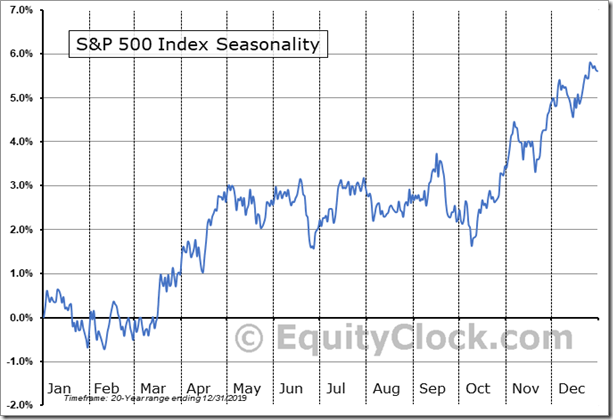
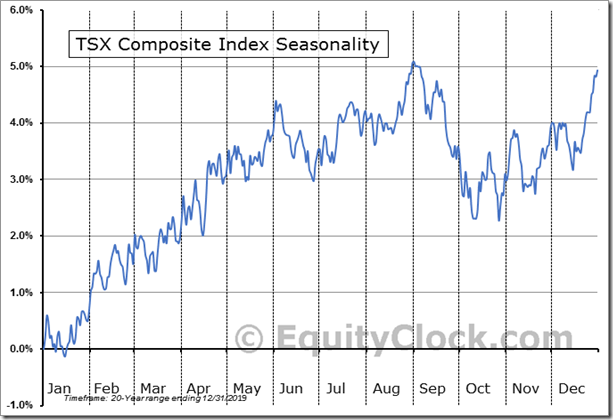
Summer rally this year? North American equity markets have a history of moving higher from the last week in June to the third week in July in anticipation of strong and improving second quarter corporate results. However, favourable anticipation of second quarter corporate results this year is less likely. Second quarter earnings by S&P 500 companies are expected to drop 43.8%.. Second quarter earnings by TSX 60 companies are expected to drop 20.5%.
Consensus estimates for earnings and revenues by S&P 500 companies turn positive on a year-over-year basis in the first quarter of 2021. According to FactSet, earnings in the first quarter are expected to increase 13.0% (versus 12.6% last week) and revenues are expected to increase 2.9% (versus 2.7% last week). Earnings for all of 2021 are expected to increase 28.2% (versus 28.8% last week) and revenues are expected to increase 8.5%.
Economic News This Week
June Services PMI to be released at 10:00 AM EDT on Monday is expected to improve to 49.5 from 45.4 in May.
Bank of Canada business survey is released at 10:30 AM EDT on Monday/
May Wholesale Inventories to be released at 10:00 AM EDT on Thursday is expected to drop 1.2% versus a gain of 0.3% in April.
June Producer Price Index to be released at 8:30 AM EDT on Friday is expected to increase 0.4% versus a gain of 0.4% in May. Excluding food and energy, June Producer Price Index is expected to increase 0.1% versus a drop of 0.1% in May.
June Canadian Employment to be released at 8:30 AM EDT on Friday is expected to increase 675,000 versus 289,600 in May. June Unemployment Rate is expected to drop to 11.9% from 13.7% in May.
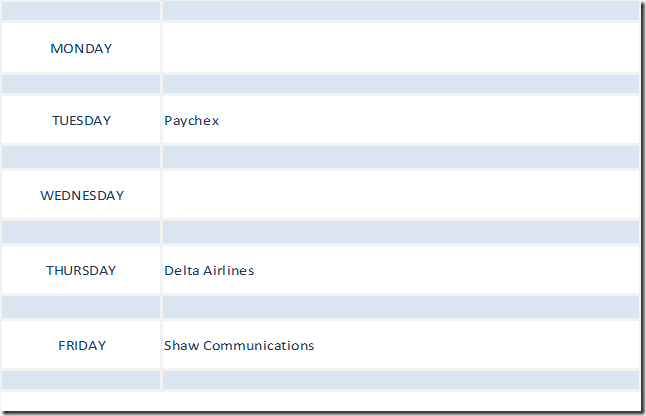
Earnings News This Week
Trader’s Corner
No changes on Friday.
Equity Indices and related ETFs
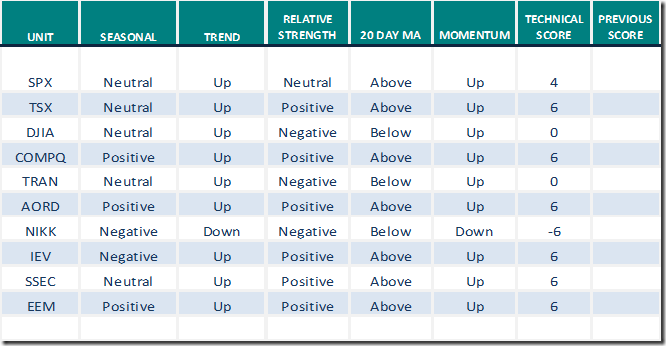
Daily Seasonal/Technical Equity Trends for July 3rd 2020
Green: Increase from previous day
Red: Decrease from previous day
Commodities
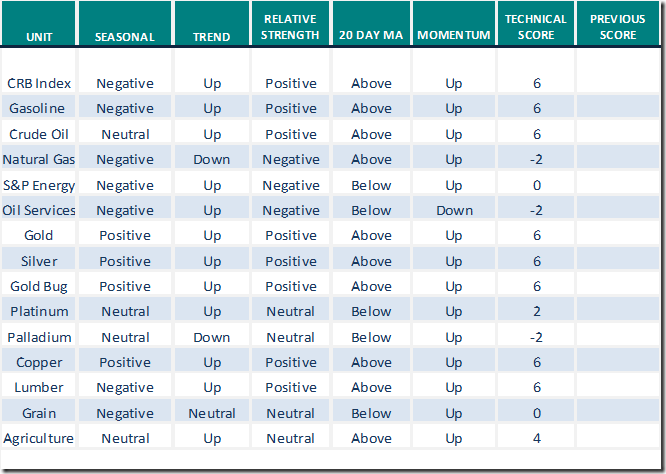
Seasonal/Technical Commodities Trends for July 3rd 2020
Green: Increase from previous day
Red: Decrease from previous day
Sectors
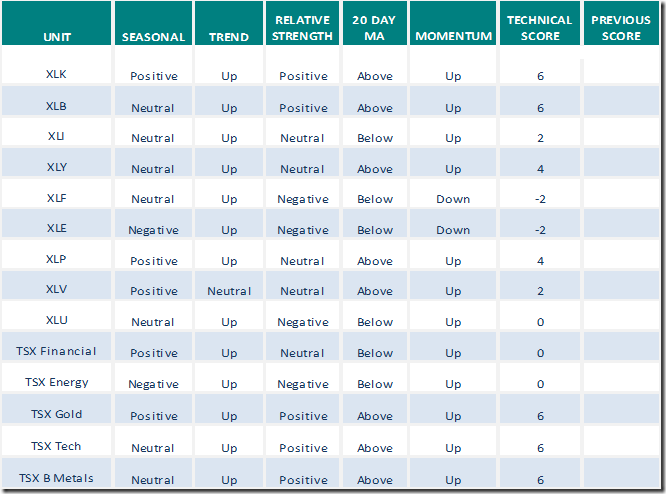
Daily Seasonal/Technical Sector Trends for July 3rd 2020
Green: Increase from previous day
Red: Decrease from previous day
Technical Scores
Calculated as follows:
Intermediate Uptrend based on at least 20 trading days: Score 2
(Higher highs and higher lows)
Intermediate Neutral trend: Score 0
(Not up or down)
Intermediate Downtrend: Score -2
(Lower highs and lower lows)
Outperformance relative to the S&P 500 Index: Score: 2
Neutral Performance relative to the S&P 500 Index: 0
Underperformance relative to the S&P 500 Index: Score –2
Above 20 day moving average: Score 1
At 20 day moving average: Score: 0
Below 20 day moving average: –1
Up trending momentum indicators (Daily Stochastics, RSI and MACD): 1
Mixed momentum indicators: 0
Down trending momentum indicators: –1
Technical scores range from -6 to +6. Technical buy signals based on the above guidelines start when a security advances to at least 0.0, but preferably 2.0 or higher. Technical sell/short signals start when a security descends to 0, but preferably -2.0 or lower.
Long positions require maintaining a technical score of -2.0 or higher. Conversely, a short position requires maintaining a technical score of +2.0 or lower
Changes Last Week
S&P 500 Momentum Barometer
The Barometer advanced last week from 47.49 to 69.94. It changed from intermediate neutral to intermediate over bought on a move above 60.00
TSX Momentum Barometer
The Barometer advanced last week from 56.34 to 74.53. It changed from intermediate neutral to intermediate over bought. It changed from intermediate neutral to intermediate over bought on a move above 60.00.
Disclaimer: Seasonality and technical ratings offered in this report and at
www.equityclock.com are for information only. They should not be considered as advice to purchase or to sell mentioned securities. Data offered in this report is believed to be accurate, but is not guaranteed
This post was originally publised at Vialoux's Tech Talk.


![clip_image002[1] clip_image002[1]](https://advisoranalyst.com/wp-content/uploads/2020/07/clip_image0021_thumb-2.png)
![clip_image003[1] clip_image003[1]](https://advisoranalyst.com/wp-content/uploads/2020/07/clip_image0031_thumb-1.png)
