
by Brian Levitt, Invesco Canada
John Krasinksi of The Office and Jack Ryan fame recently initiated a web series entitled “Some Good News.” It’s a news program devoted entirely to good news. I wish I had thought of that. Since I didn’t, I’m left to borrow the concept. This blog, and subsequent ones in this series, will be devoted entirely to producing lists of good (or less bad) news. After all, as Dwight Schrute says in the episode of “The Office” in which Jim Halpert mockingly takes on Dwight’s persona, “Imitation is the most sincere form of flattery. So, I thank you.”
Admittedly, I’m not entirely clear how citing the positive news will be received. I have concerns about being viewed as Pollyanna in the middle of an ongoing pandemic and disastrous loss in jobs and economic activity. However, at this point, our depth of despair is largely a given. Plus, Krasinksi has millions of subscribers, a fact that suggests there is an appetite for some positivity, even as we recognize that many challenges persist.
Here goes:
- Many countries appear to have successfully “bent the curve” in the number of new daily coronavirus cases. In the U.S., the 7-day average of new cases peaked on April 11, at 31,942, and that number has been consistently below 30,000 since May 3. The 7-day average of new cases on May 15 was 22,988, the lowest since early April.1
- Australia is reporting a 90% drop in case growth and is on course to remove all domestic restrictions by July.2
- Testing in the U.S. appears to be ramping up, although it is still below the levels recommended to fully control the virus. During the week of May 5, the U.S. averaged nearly 300,000 new coronavirus tests a day, nearly double the roughly 150,000 daily tests performed in early April.3
- R0 (pronounced R naught) has fallen below 1.0 in 46 states. The R0 in Europe is currently being estimated at 0.8.4 R0 represents the number of new infections estimated to stem from a single case. An R0 below 1 suggests that the number of cases is shrinking. New York, the hardest-hit state, has seen its R0 plunge below 1,4 although, admittedly, mobility remains very limited. We will be watching the R0 closely in states that are opening, while also recognizing that changes in mobility and testing could change these numbers.
- There are currently more than 90 COVID-19 vaccines in development.
- Despite everything, the S&P 500 Index is up 25% since Christmas 2018.5 Market volatility, as measured by the CBOE VIX index, has been more than halved since reaching an all-time high at the end of March 2020.
- Financial conditions have eased meaningfully since the middle of March.6 Conditions have remained relatively tight from a historical perspective but have been relatively stable for over a month. That has been driven by the relative stability of both the U.S. dollar7 and U.S. investment grade corporate bond spreads.8
- The price of oil, as represented by the U.S. West Texas Intermediate (WTI) benchmark, has rebounded and is closing in on US$30/barrel as the supply overhang appears to have peaked.9
- The peak increase in jobless claims came the week of April 3. Jobless claims have still been increasing each week at a catastrophic clip. But the rate of change in that increase has been slowing, from early April, when 6.6 million new claims were filed in the week, to mid-April, when 4.4 million new claims were filed in the week, to Thursday, May 14, when it was reported that 2.9 million new claims were filed in the week.10 The numbers have been alarming, but they have been deteriorating at a less alarming rate. Historically, markets tend to trough around the time that jobless claims peak.11
- The Economic Cycle Research Institute’s Leading Weekly Index, which comprises real M2 (all the money available in an economy, including cash and checking deposits), commodity prices, and jobless claims, among other indicators, appears to have bottomed and has been slowly recovering for six consecutive weeks.12
Figure 1: Leading economic indicators appear to be turning
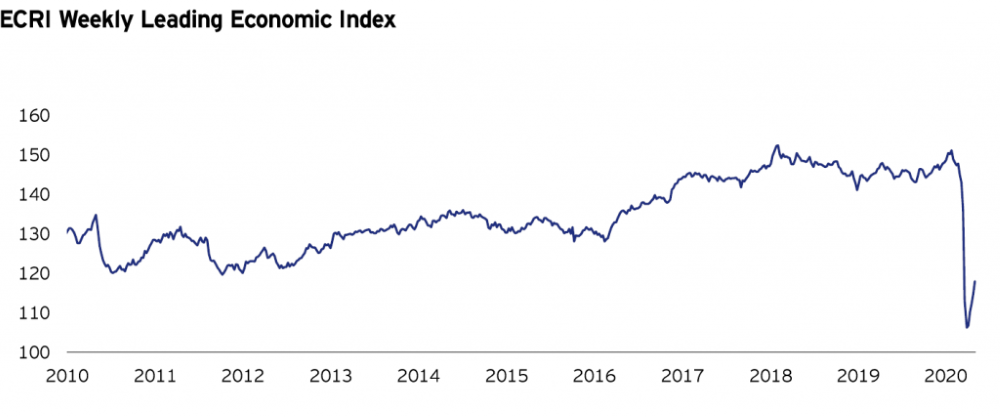
Source: Economic Cycle Research Institute as of 5/1/20.
So, is the glass half empty or half full? As Dwight Schrute says, “False. The glass is always full, as it is half water and half air.”
*****
This post was first published at the official blog of Invesco Canada.