


by Craig Basinger, Derek Benedet, Chris Kerlow, Alexander Tjiang, Richardson GMP
To say the market performance so far in 2020 has been relatively unkind to value and small-cap style investors is clearly an understatement. Value, which has been largely underperforming Growth for most of the past decade, has done even worse during this current bear market. And Small Cap has fared even worse.
We all know 2020 has been a challenging year, to say the least. The S&P 500 is down about 13% year-to-date. However, the S&P 500 Value index is down 21% while the S&P 500 Growth index is down a mere 7%. This brings the Value index’s 10-year annualized return down to +8.4% while Growth enjoyed +13.2%. For small cap, the S&P 600 Small Cap index is down 30% so far in 2020, while the S&P 100 large-cap index is down 10%.
There are a number of factors contributing to these material divergences during this bear market, which we will tackle separately.
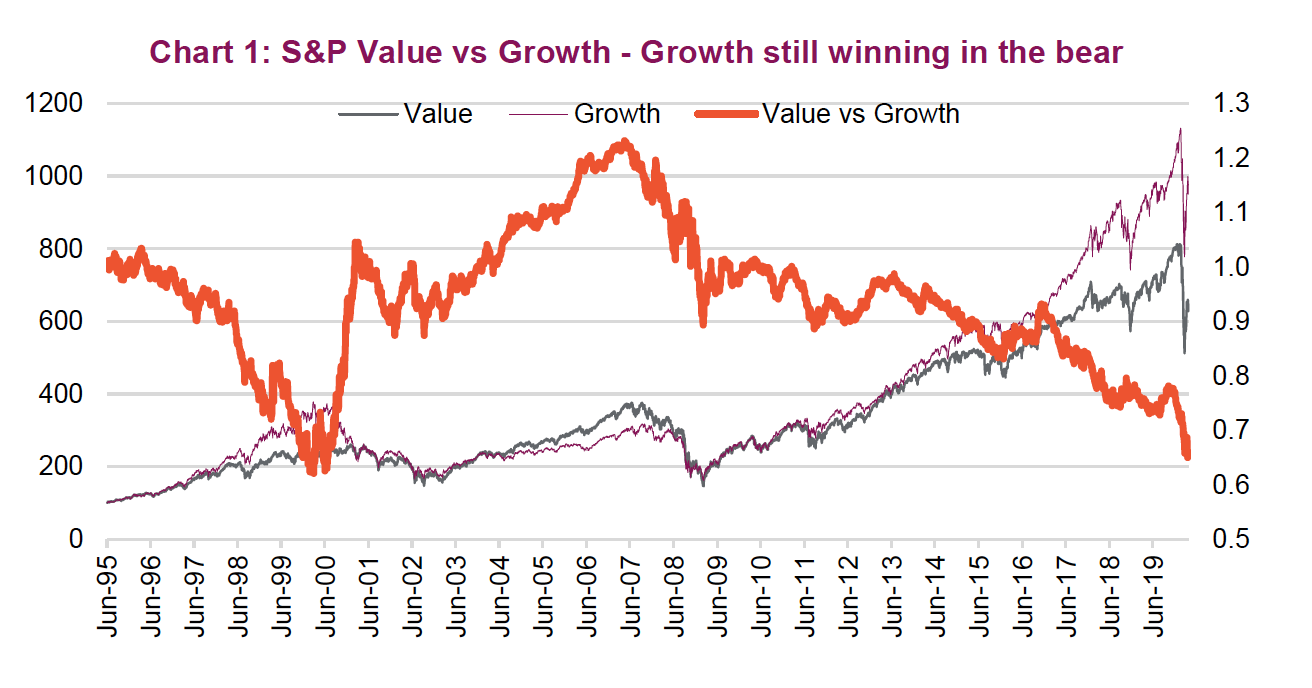 Why has Value lagged so much? Someone who believes markets revert to the mean over time might have thought value, after a decade of underperformance during the bull market, would shine in the bear. Clearly not so far. In fact, value should have outperformed during this near record long bull market as decent economic growth lifts all boats. This wasn’t the case during the most recent bull, that many attribute to various factors including too much easy money, low interest rates, passive ETF flows, etc. But during 2020 there have been a few big factors weighing against Value.
Value stocks tend to carry more debt. Given how quickly the economy has been slowed to fight the pandemic, debt is a four-letter word. This has raised default risk and potentially solvency, especially for those carrying a lot of debt. Also, relative to Growth stocks, Value has greater operational leverage. This means a small change in sales/revenue has a magnified impact on the bottom line or cash flow. Again, this is not great when the economy slows suddenly. Finally, Value is more sensitive to economic growth and we are clearly in at least a technical recession or, at worse, a real one.
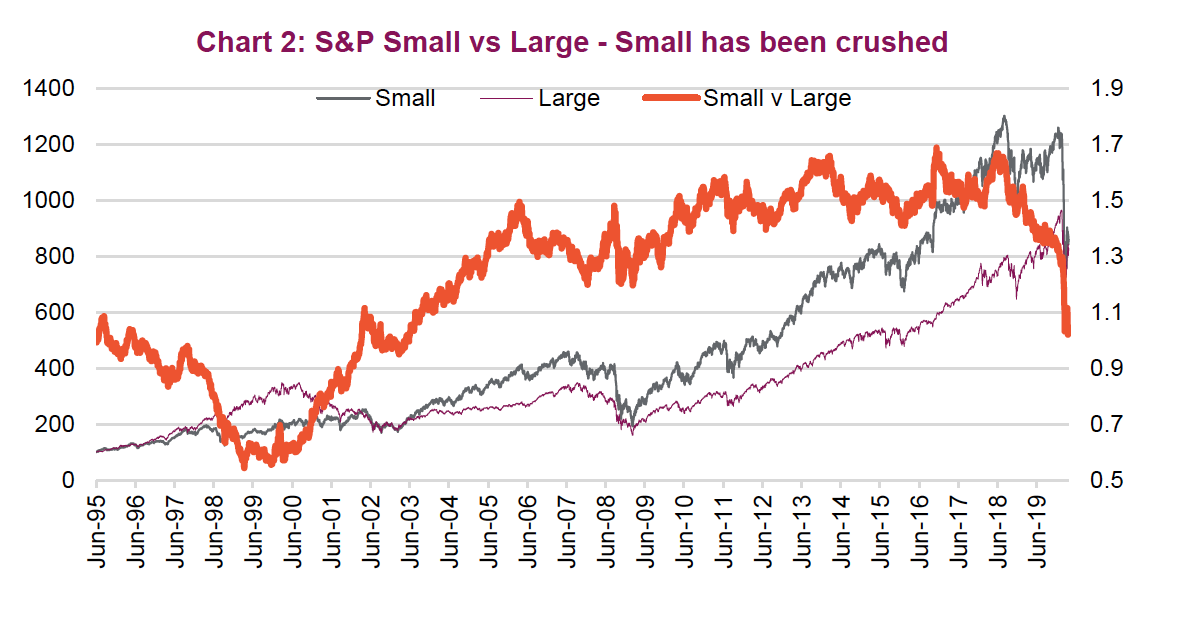
Why has Small Cap lagged? Well, Small Cap actually did much better at keeping pace with Large Cap during the past bull market, and then ran smack into a bear market/recession that is size biased (chart 2). If you consider what parts of the economy are most at risk from the current economic world, it is small businesses. While this risk is most pronounced for sole proprietary or smaller businesses, this skewed impact carries into the small-cap public market relative to the large caps.
Style / size is not a binary question
In physics there are proofs or laws that have been researched, tested and are determined to be true. This includes the law of gravity, which on earth causes an object in freefall to accelerate at 9.8m/s^2 (ignoring air friction of course). However, the markets do not lend themselves to proofs or laws because investing is more like a social science. The behaviour of the participants/investors has an impact on the outcome. And these behaviours change over time due to a host of factors such as demographics, technology, the economy, alternatives investment options, sentiment and knowledge.
Since market participants change their behaviour over time, any “proof” that is found may hold for a time but also may not. The fact is, there is no dominant style or factor when investing simply because once one is found, increased demand or use of that factor will reduce its benefit. If there is alpha to be had, that alpha will be shared across more and more investors, until it become less measurable. And then new factors will be discovered, and the dance continues.
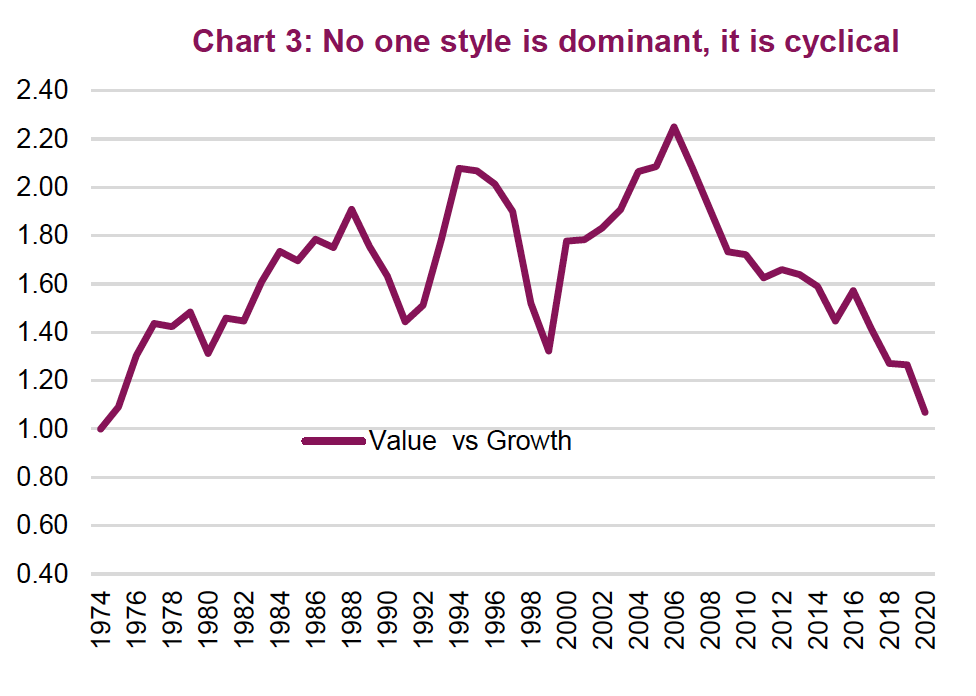
Value investing dominated Growth from the mid 1970s until about 2005, with a few counter trend periods. Since then, Growth has dominated Value and the relative performance has come back to when the S&P value and growth indices were created in 1974 (Chart 3). This doesn’t necessarily mean it is time for Value again – that line could just as easily go down further.
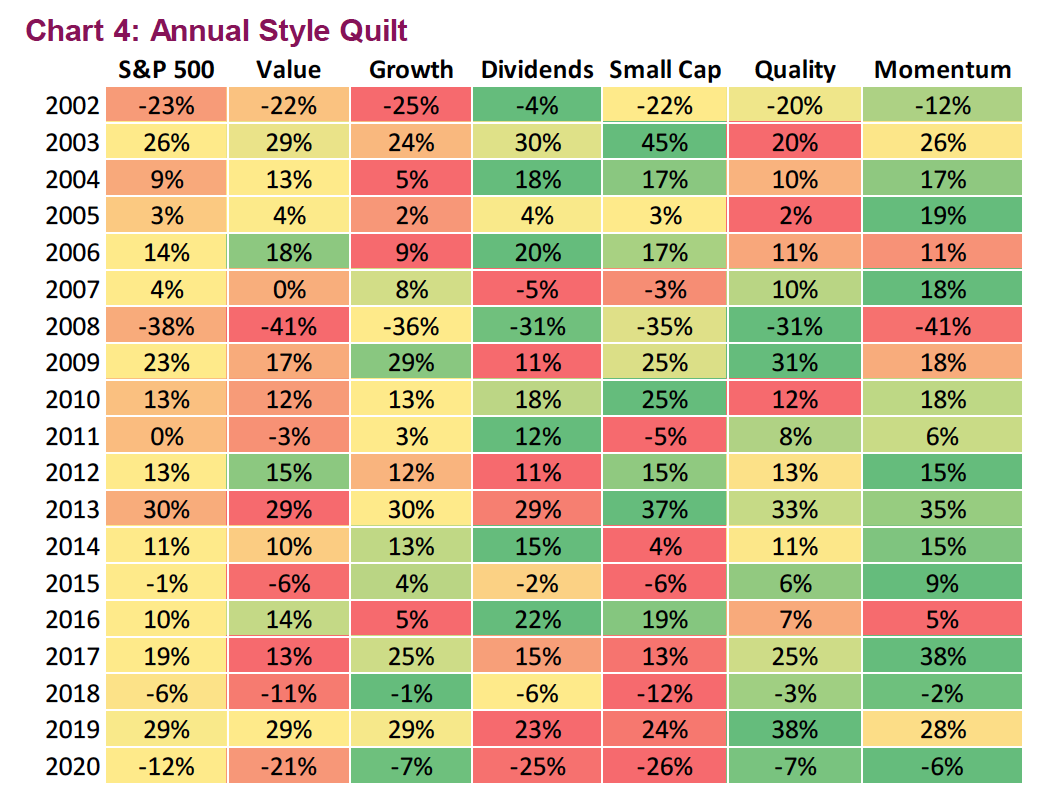
To demonstrate further the rotation across factors that takes place, Chart 4 provides an annual style quilt for the S&P 500. The colour coding is for each year; dark green means that was the best style for the year. If deep red, it was the worst. Several noteworthy points can be seen in this quilt. Yes, Small Cap and Value have had a higher run of reds than other styles; so have dividends of late. 2019 was a strong rebound year, leaving the dividend payers trailing and since this current bear punishes companies with debt, that too may be hurting dividend-focused strategies. Momentum has been one of the stronger strategies or factors for much of the past decade. And of course, there are many more momentum strategies today than there were a decade ago. The dance continues!
Investment Implications. There is no one factor that consistently works best because the market dynamics change, and the market participants change behaviours. We believe portfolio managers or asset allocators can add value by tilting more towards some factors and being lighter on others, investors must remember alpha adding factors will change over time. A diversified portfolio should have some exposure to all factors.
*****