by William Smead, Smead Capital Management
In 1991, during the first Gulf War, Scud missiles were shot into Israel by Iraqi forces. The towns of Tel Aviv and Haifa were targeted. An American company, Raytheon, had developed a missile technology to shoot those Scud missiles down on their way from launch. In the middle of that scary war scenario, investors were calling their brokers and asking to buy shares of Raytheon. It was a temporary high in common stock popularity for Raytheon, but it was a low point for businesses which were negatively affected by a massive business slowdown which occurred from August 4, 1990 until the victory that “Shock and Awe” created in January of 1991.
Buying shares of Raytheon might have looked smart, but the far better strategy was to invest in all of the meritorious businesses which sold off sharply during that economic time out. To do so required a willingness to look foolish for an extended period of time. We will present the most difficult investment junctures of the last 40 years, tell you what was popular and what produced the highest future returns. We will consider looking foolish with the goal of obtaining long-term wealth creation in common stock ownership.
1981
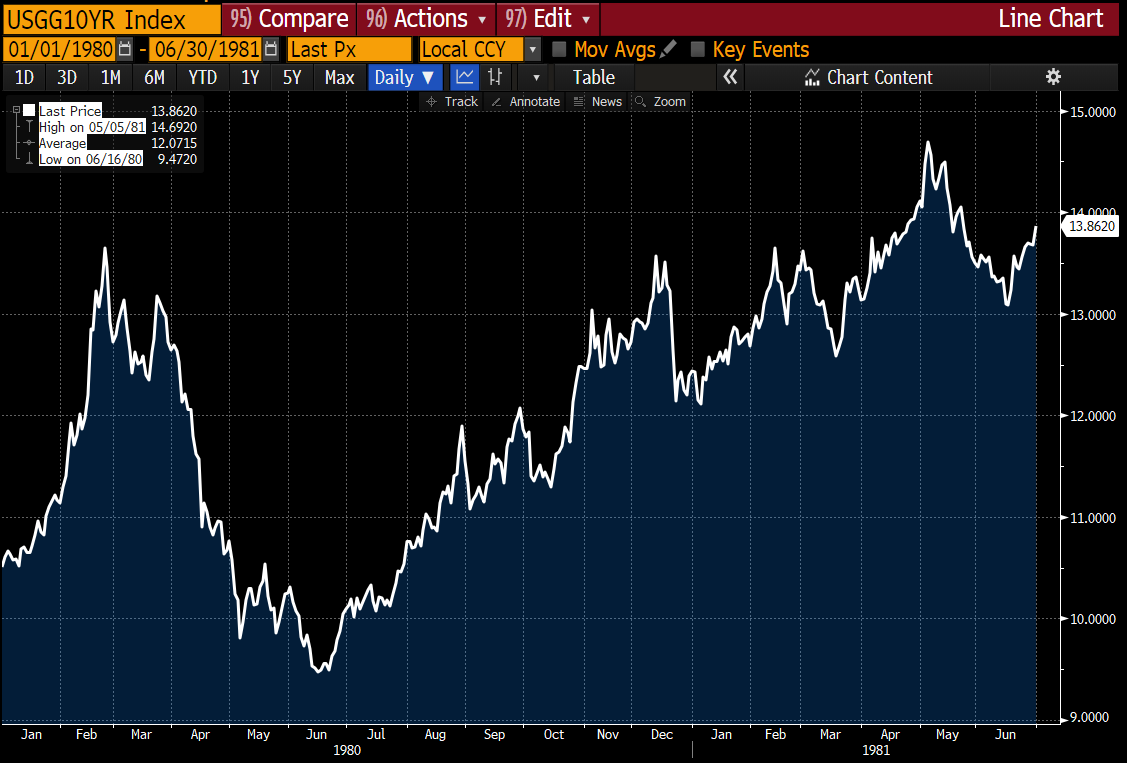
Source: Bloomberg. Data for the time period 1/1/1980 – 6/30/1981.
In 1981, Fed Chairman, Paul Volcker, tightened credit and drove 3-month Treasury bills to 18%. Ten-year Treasury bonds peaked at 14.69%. Money market funds were paying 15% and were liquid. If you bought a Treasury bond due in ten years in 1981, you looked very foolish, because you sat with those bonds with capital losses temporarily.
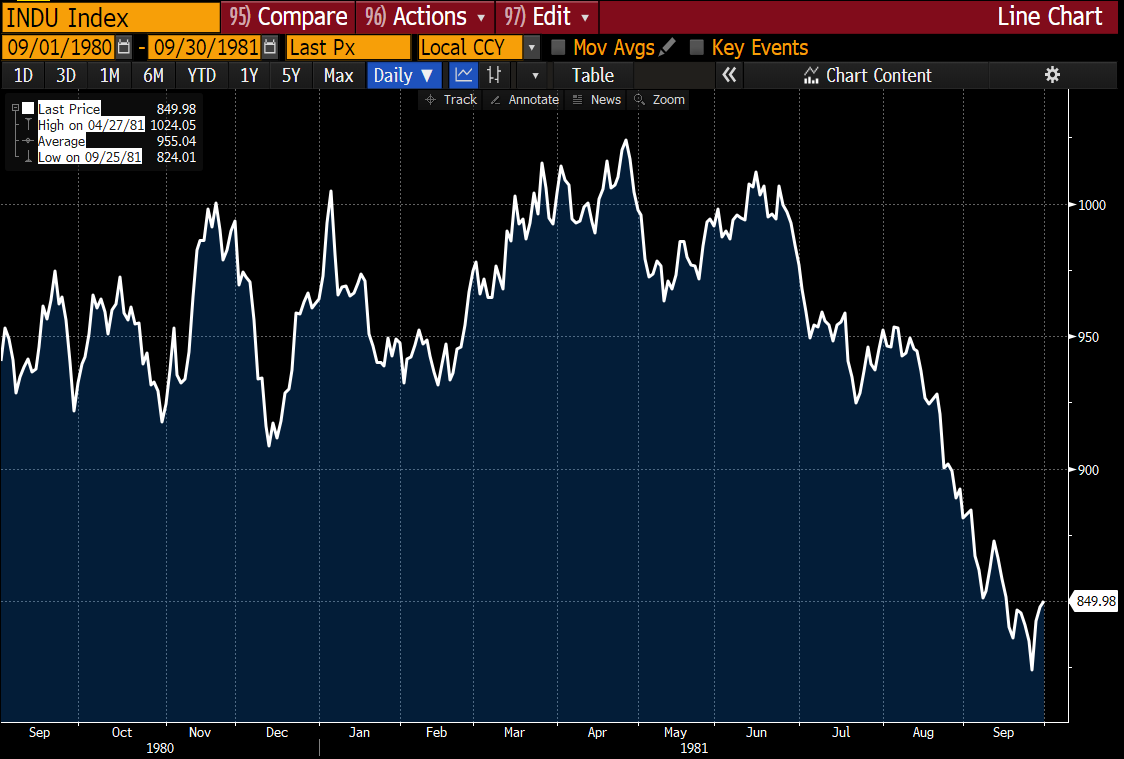
Source: Bloomberg. Data for the time period 9/1/1980 – 9/30/1981.
Simultaneously, stocks fell from 1,000 on the Dow Jones Industrial Average in June of 1981 to 800 in September of 1981. Cheap stocks at eight-times profits became cheap stocks at 6.4 times profits. You looked foolish for buying the bonds in 1981 and you looked foolish for buying the stocks as well.
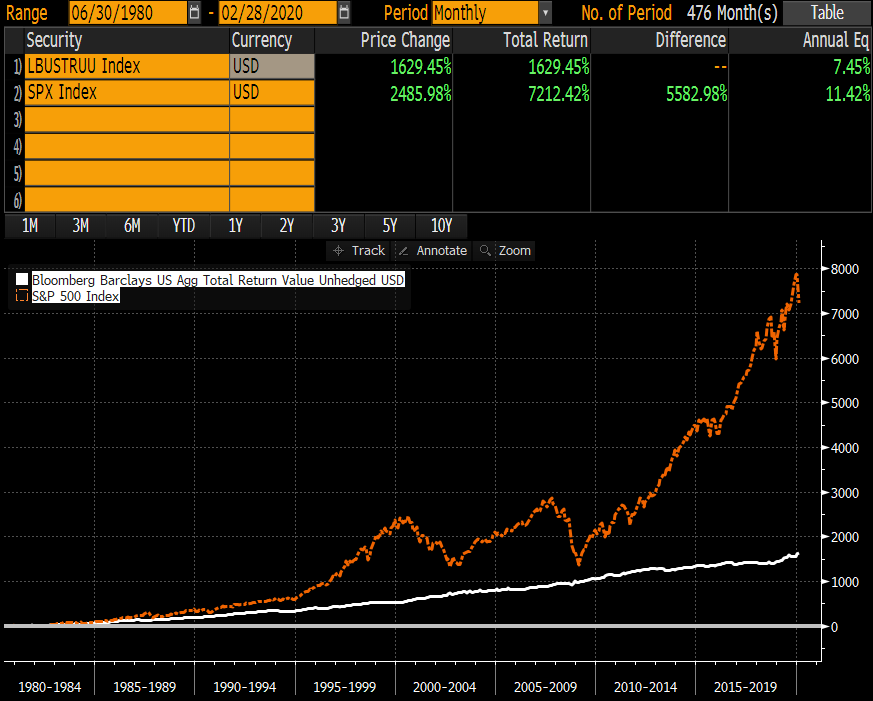
Source: Bloomberg. Data for the time period 6/30/1980 – 2/28/2020.
As you can see, buying those bonds and buying those stocks over the following 39 years produced way above historical average returns for investors.
1999
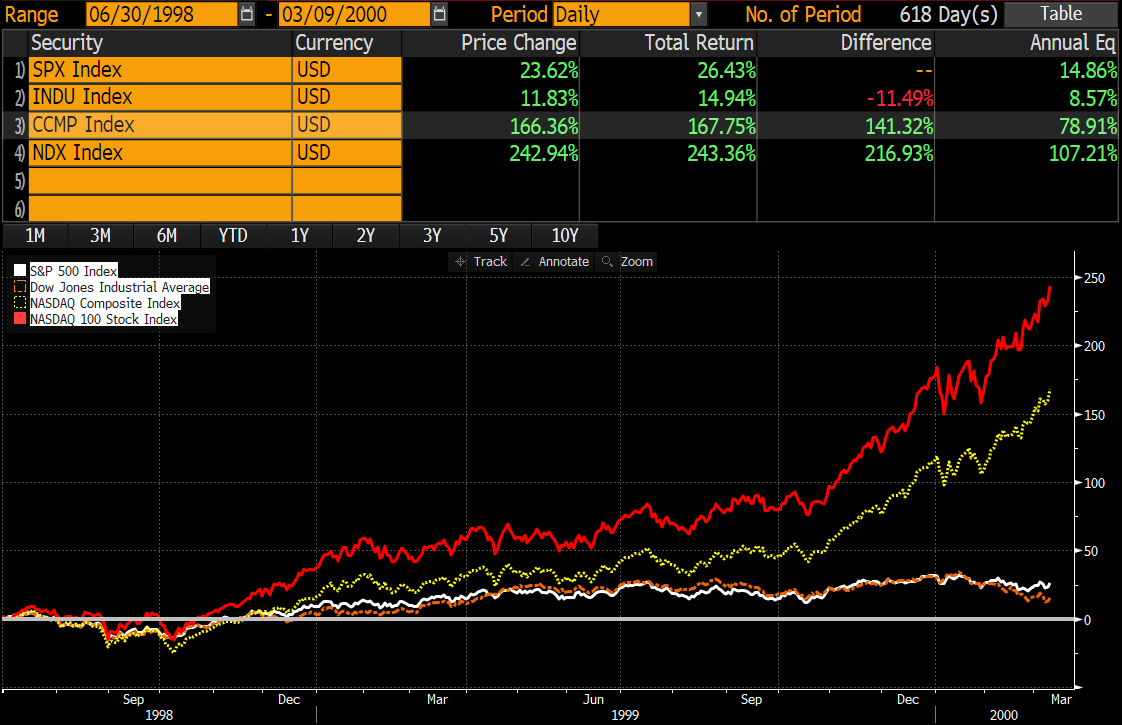
Source: Bloomberg. Data for the time period 6/30/1998 – 3/9/2000.
Tech stocks went berserk as represented by the NASDAQ Index rising 107.21%, while the Dow Jones Industrial Average gained 8.57%. Avoiding tech stocks was a suicide mission and those of us who avoided them looked extremely foolish.
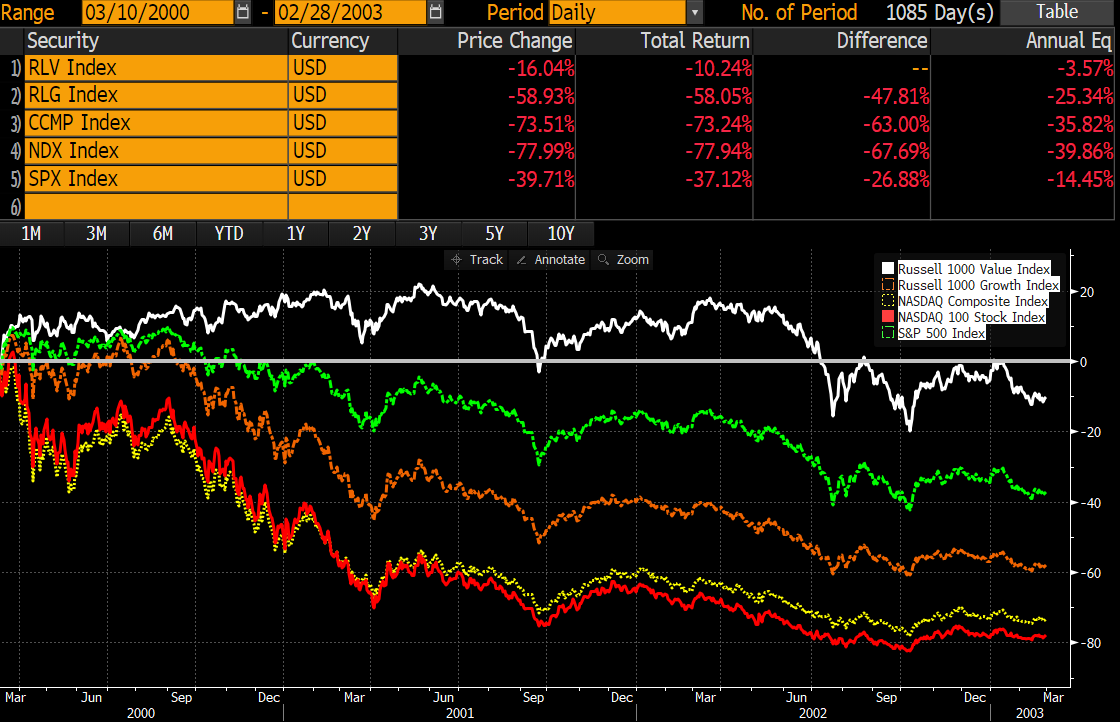
Source: Bloomberg. Data for the time period 3/10/2000 – 2/28/2003.
Massive heartache was wrought on investors as their portfolios got bludgeoned in popular securities. Investors who were willing to look foolish skipped the bear market of 2000-2003, if they fled tech stocks while they were popular.
2008
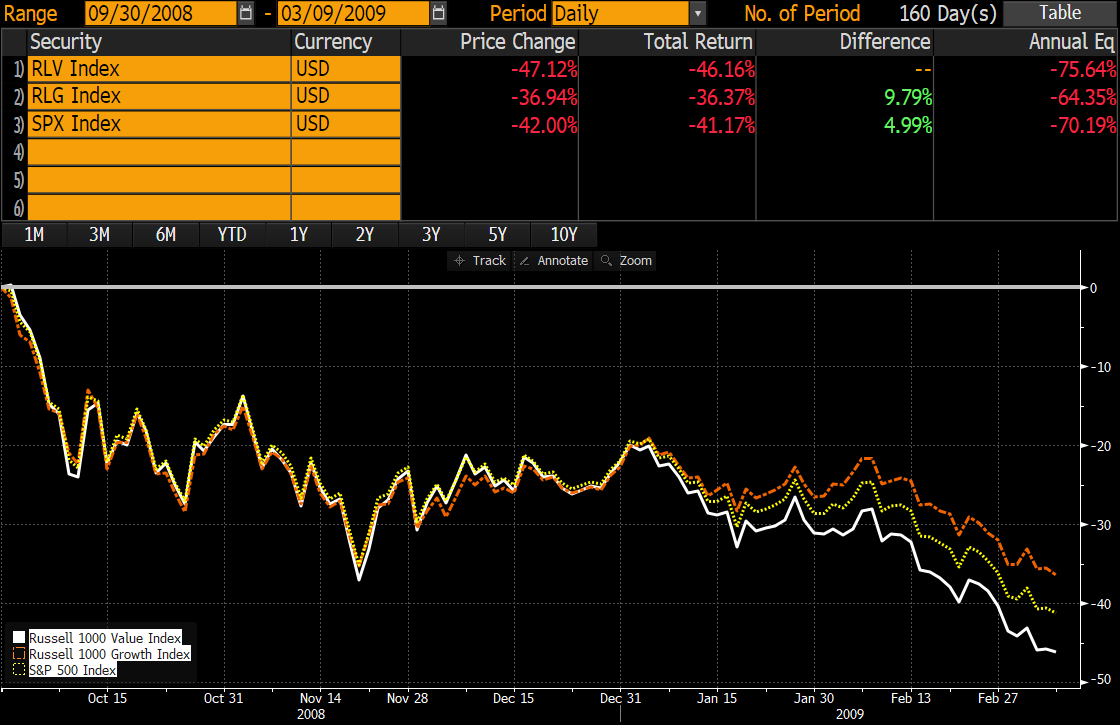
Source: Bloomberg. Data for the time period 9/30/2008 – 3/9/2009.
The S&P 500 Index went down 41% in five months and nine days. If you were a buyer of stocks, you felt like a fool and an idiot, all at the same time. Bank stocks were especially hard hit.
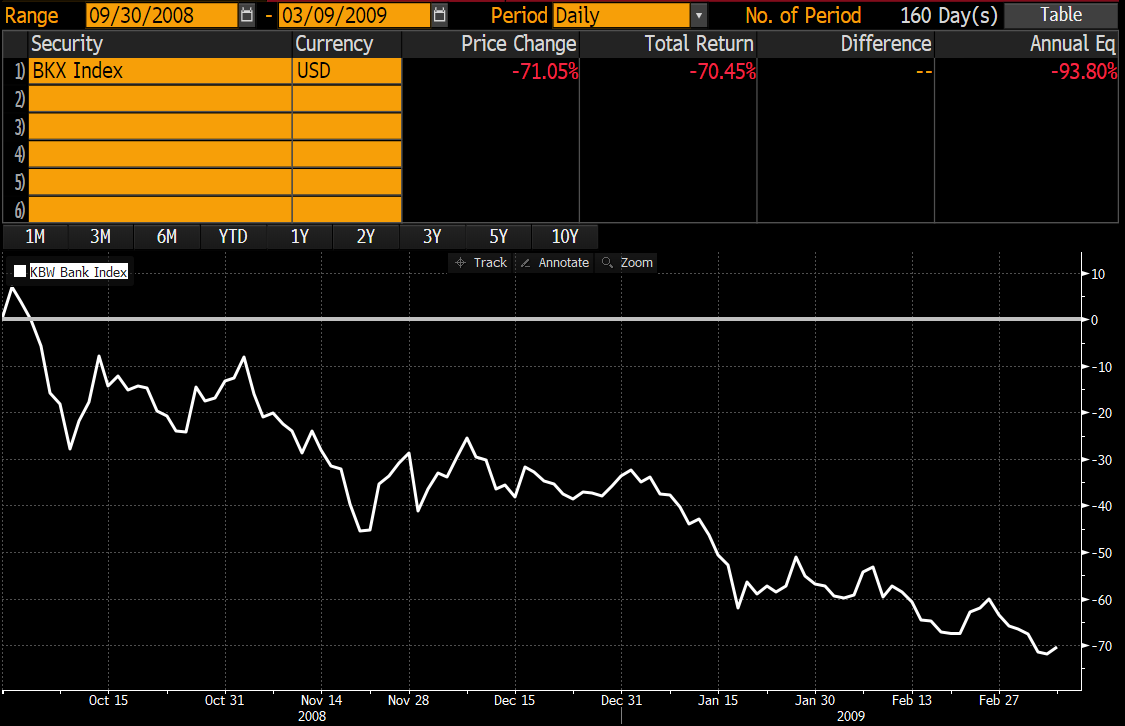
Source: Bloomberg. Data for the time period 9/30/2008 – 3/9/2009. The BKX Index is designed to track the performance of the leading banks and thrifts that are publicly traded in the U.S.
If you were fortunate enough to be foolish in late 2008 and early 2009, you got wealthy owning the major U.S. banks.
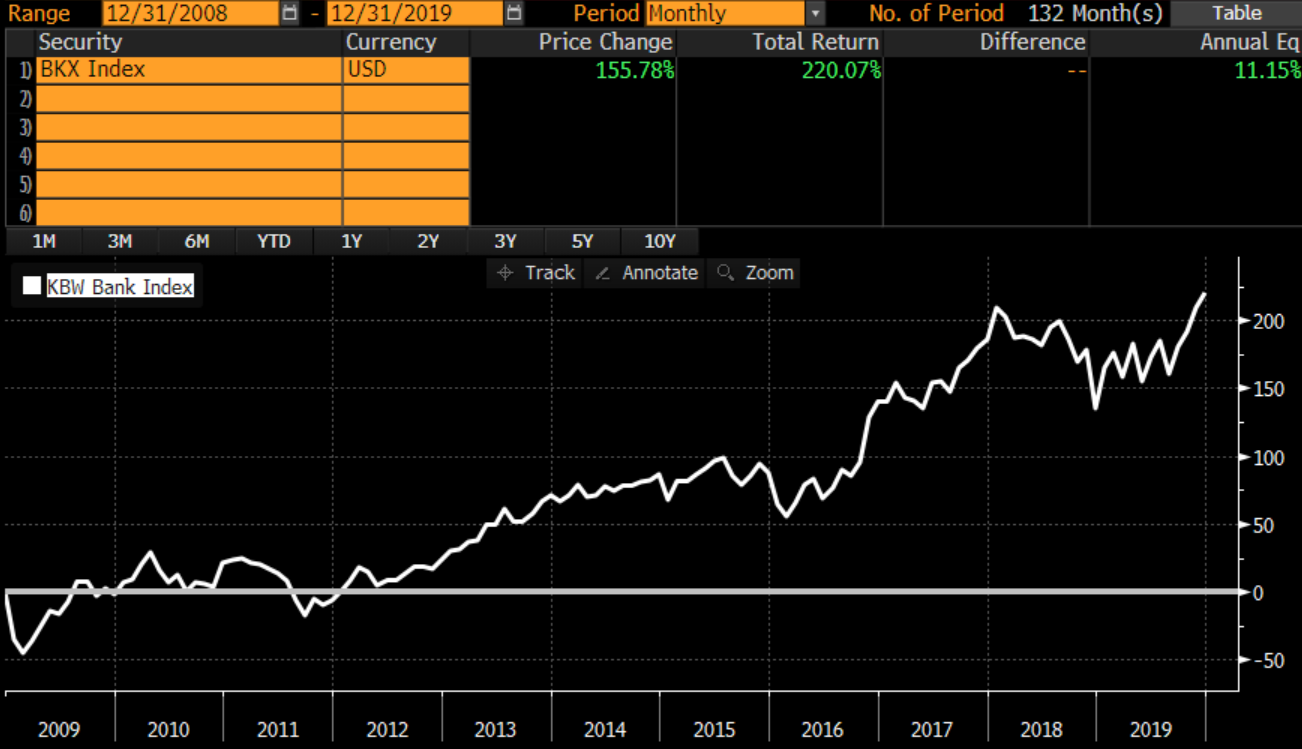
Source: Bloomberg. Data for the time period 12/31 /2008 – 12/31/2019.
Today
Stocks have been smashed and investors are over-paying for the Raytheon’s of today. There is no leverage coming off of this massive economic time out for the companies benefitting from it! We need to be reminded of what matters the next ten years in the U.S. economy.
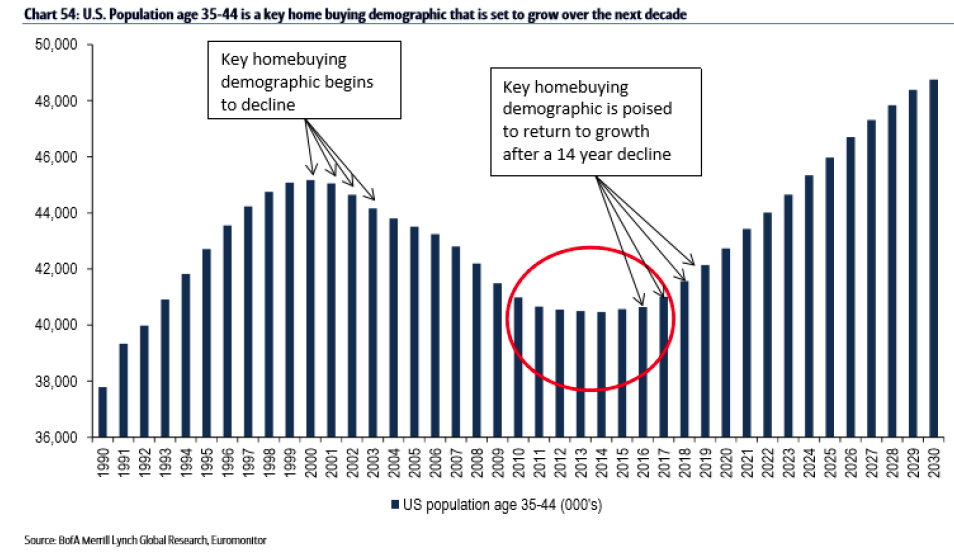
Source: BofA Merrill Lynch Global Research Data for the time period 1/1/1990-12/31/2030. Forecasted data is projected.
- Above average income households are exploding over the next ten years as 90 million millennials hit the 30-45-year-old sweet spot.
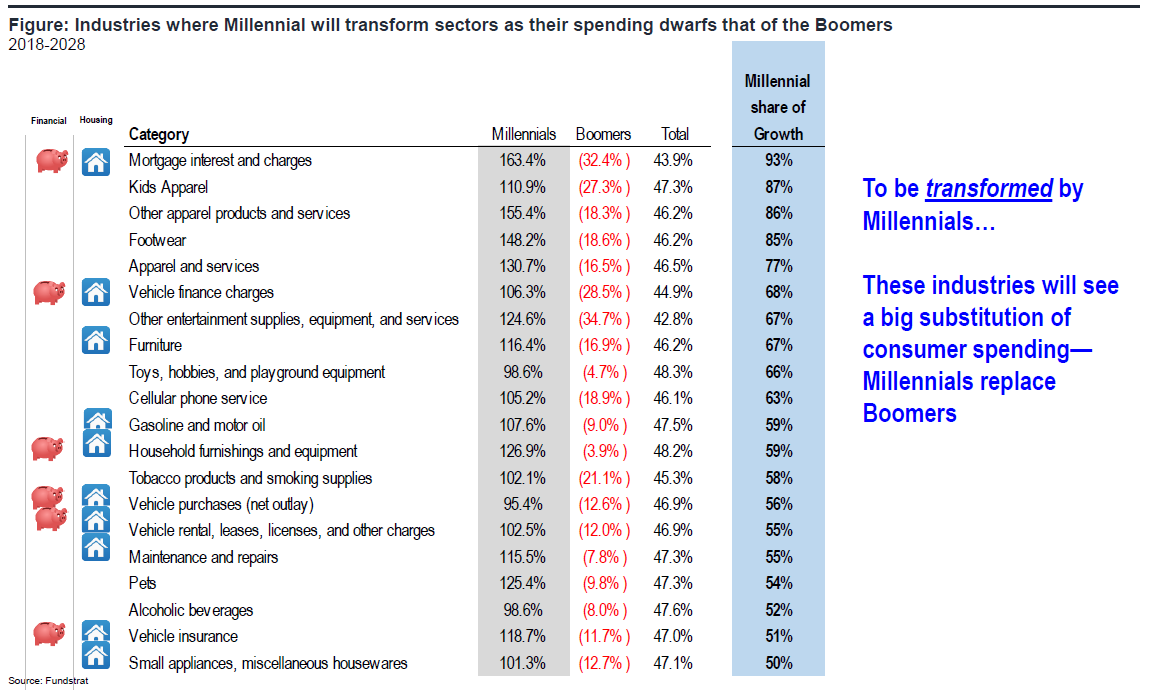
Source: Fundstrat, “The Long Game,” 2019 Strategy. Data as of 12/31/2018. - Spending will tilt heavily toward house, home and kids.
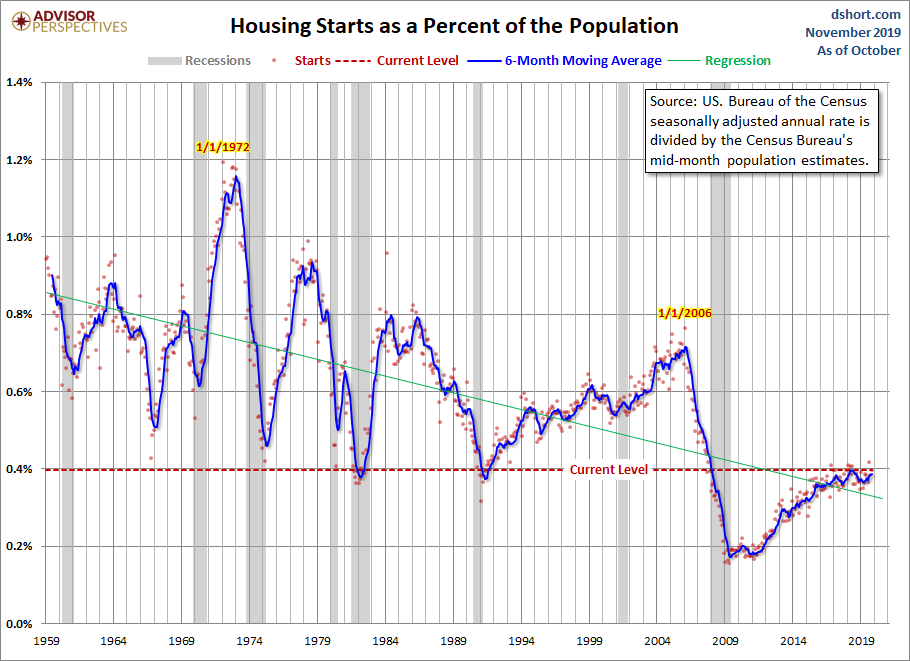
Source: dshort.com and Advisor Perspectives. Data for the time period 1/1/1959 – 10/31/2019. - We are massively under built in single-family residences
- Mortgages are cheap
- Gasoline is cheap
We are going to invest based on what looks the best over the next three to five years and ignore how foolish we might look in the meantime. Does anyone really know how fast the U.S. economy will bounce back after the coronavirus work stoppage is over? Value has rarely ever looked better in relation to growth, economically sensitive has rarely looked better than low volatility/staple companies and glamour tech has rarely looked more over-cooked than now in this Raytheon moment.
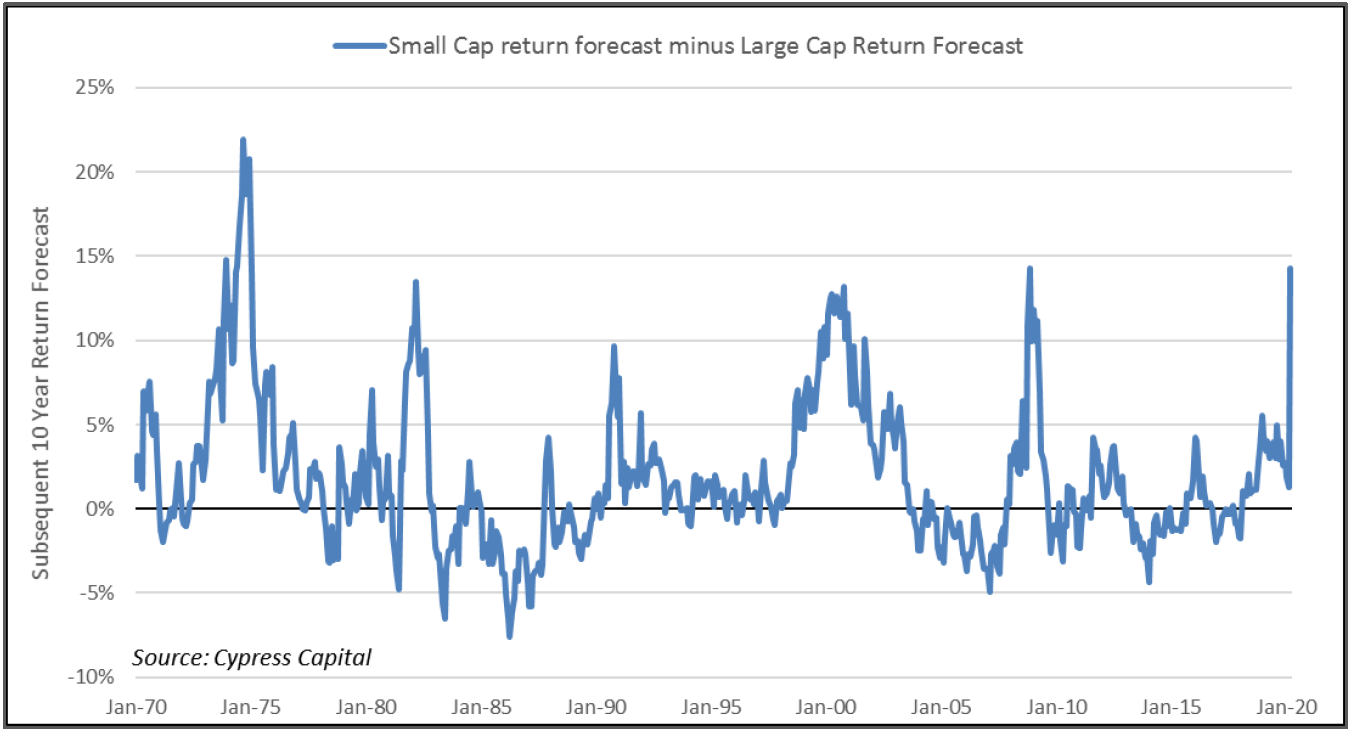
Source: Cypress Capital Market Outlook. Data as of March 27, 2020.
Insider buyers are telling us what to do by loading up on the economically sensitive stocks which look foolish in the short run, but may have the most upside when this is all over. Notice we are repeating the insider bullishness of the bottom of 2008-2009.
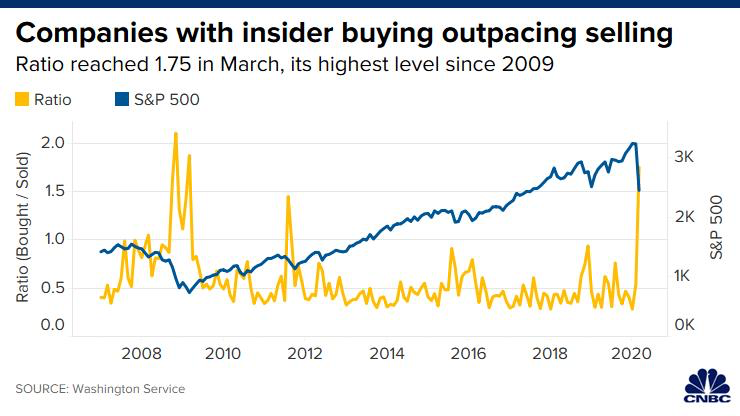
Source: CNBC and Washington Service. Data as of March 26, 2020.
In conclusion, we are going to repeat our enthusiasm for what we view as the best economics of the next ten years, in very much the same way we did at the bottom in 2009. We will do so within the context of our eight criteria for common stock selection. This smashing of economic hopes, right before one of our brightest demographic phases, could be a bonanza which only those of us who are willing to look foolish can acquire. We are reemphasizing home builders like Lennar (LEN), banks like Wells Fargo (WFC), credit cards from American Express (AXP) and kids apparel from Target (TGT). Coming out of this violent panic created by a virus which seemed to come out of nowhere, will take time. Thank you for your steadfast support and capital commitments.
*****
The recent growth in the stock market has helped to produce short-term returns for some asset classes that are not typical and may not continue in the future. Margin of safety is the difference between the intrinsic value of a stock and its market price. The price-earnings ratio (P/E Ratio or P/E Multiple) measures a company’s current share price relative to its per-share earnings. Alpha is a measure of performance on a risk-adjusted basis. Beta is a measure of the volatility of a security or a portfolio in comparison to the market. FAANG is an acronym for the market’s five most popular and best-performing tech stocks, namely Facebook, Apple, Amazon, Netflix and Alphabet’s Google. Growth investing is focused on the growth of an investor’s capital. Leverage is using borrowed money to increase the potential return of an investment. Momentum is the rate of acceleration of a security’s price or volume. The earnings yield refers to the earnings per share for the most recent 12-month period divided by the current market price per share. Profit margin is calculated by dividing net profits by net sales. Quality is assessed based on soft (e.g. management credibility) and hard criteria (e.g. balance sheet stability). Value is an investment tactic where stocks are selected which appear to trade for less than their intrinsic values. The dividend yield is the ratio of a company’s annual dividend compared to its share price.
The information contained herein represents the opinion of Smead Capital Management and is not intended to be a forecast of future events, a guarantee of future results, nor investment advice.
Smead Capital Management, Inc.(“SCM”) is an SEC registered investment adviser with its principal place of business in the State of Washington. SCM and its representatives are in compliance with the current registration and notice filing requirements imposed upon registered investment advisers by those states in which SCM maintains clients. SCM may only transact business in those states in which it is notice filed or qualifies for an exemption or exclusion from notice filing requirements. Registered investment adviser does not imply a certain level of skill or training.
This newsletter contains general information that is not suitable for everyone. Any information contained in this newsletter represents SCM’s opinions, and should not be construed as personalized or individualized investment advice. Past performance is no guarantee of future results. There is no guarantee that the views and opinions expressed in this newsletter will come to pass. Investing in the stock market involves gains and losses and may not be suitable for all investors. Information presented herein is subject to change without notice and should not be considered as a solicitation to buy or sell any security. SCM cannot assess, verify or guarantee the suitability of any particular investment to any particular situation and the reader of this newsletter bears complete responsibility for its own investment research and should seek the advice of a qualified investment professional that provides individualized advice prior to making any investment decisions. All opinions expressed and information and data provided therein are subject to change without notice. SCM, its officers, directors, employees and/or affiliates, may have positions in, and may, from time-to-time make purchases or sales of the securities discussed or mentioned in the publications.
This Newsletter and others are available at smeadcap.com
Copyright © Smead Capital Management


