by Craig Basinger, Chris Kerlow, Derek Benedet, Alexander Tjiang, Richardson GMP
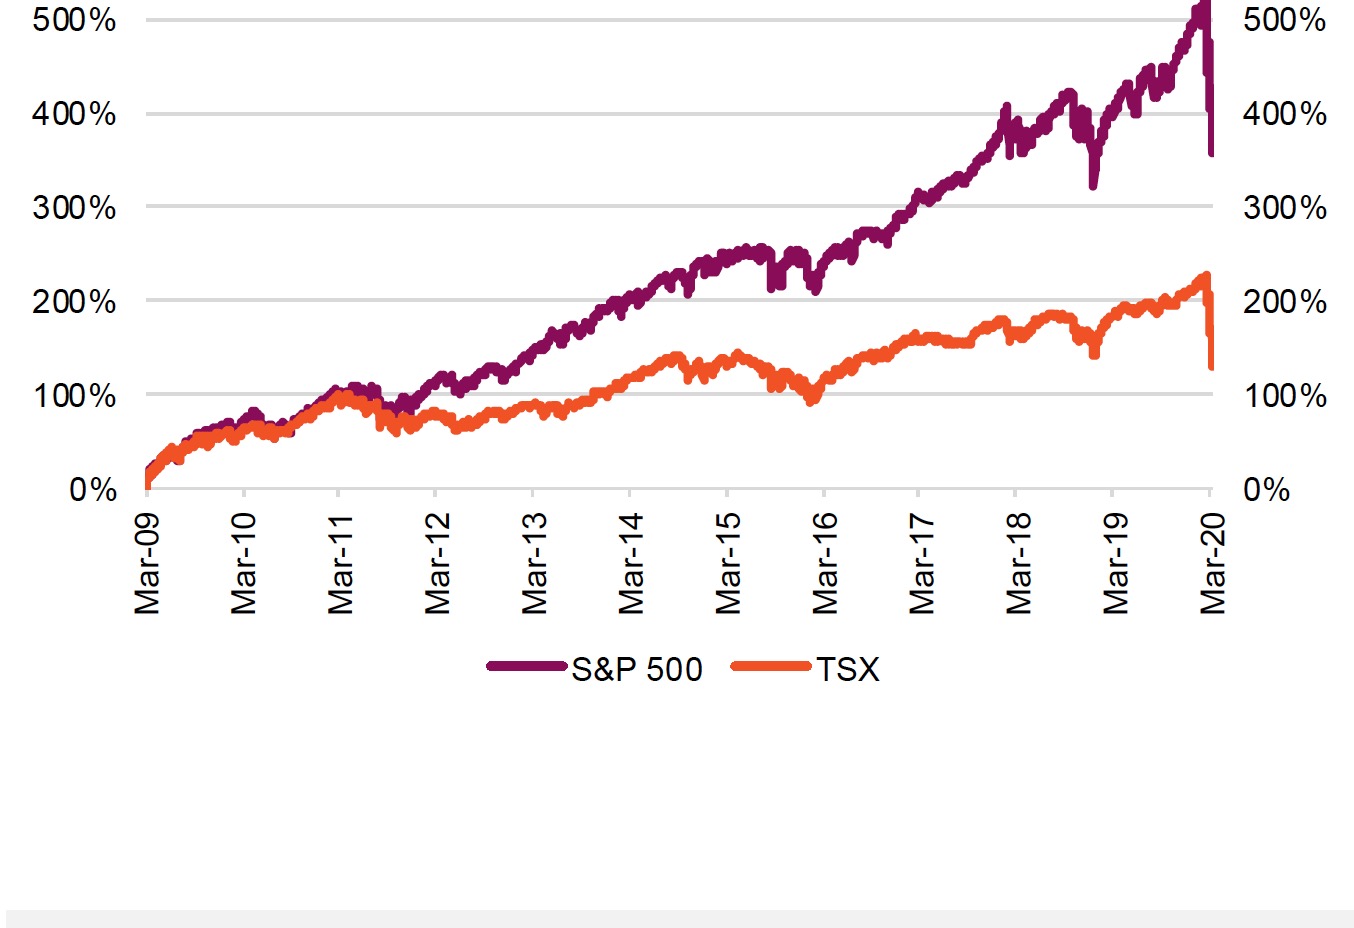
The fastest correction on record has been replaced by the fastest bear market on record as many major equity markets breached the -20% decline threshold this past week. It was just over three weeks ago that the North American markets were at all-time highs. On March 12, the TSX was down 12.3% and the S&P by 9.5%, the U.S. index’s biggest single-day loss since 1987. If it’s any consolation, that faithful day in October 1987 saw the market drop over 20% in a single day. Still, the speed of this market decline has tested the metal of just about every investor.
The bull market that started in March 2009 has now ended. For years folks have warned that the bull would end because of issues like lackluster earnings or sales growth, or tepid economic growth, or excessive central bank meddling, or even some big policy mistakes by governments – none of those did it. Instead it was a virus. A virus that has created so much uncertainty and fear that investors have rushed to hit the sell button, only slowed down by regular handwashing and trips to buy toilet paper (a priority that still confuses me).
While this has been a very violent sell off, and we do not know if the bottom is near, let’s not forget the U.S. equity market rose over 31% in 2019. In fact, the S&P 500 is still higher today than it was at the start of 2019. The TSX is less encouraging, or more encouraging depending on how you look at things. The TSX was about 14,000 at the start of 2019 and is now 12,600. It’s sobering to see that the TSX is now flat over the past five years (including dividends).
The market is attempting to quantify a pile of unknowns. How will the virus pandemic play out in other countries such as the U.S. and Canada? With more and more people working from home, cancelling travel and other plans, and stocking up on toilet paper, how much will economic growth contract? It is safe to say we are looking at growth dissipating and potentially contracting for a period. Will this prove transitory or prolonged? How will company operations and earnings be impacted? There are some potential winners such as couriers, cleaning products, companies offering connectivity platforms and, of course, streaming services like Netflix, where binge watching is likely to rise. The losers far surpass the winners, however, so we would expect a material earnings contraction in the coming quarters.
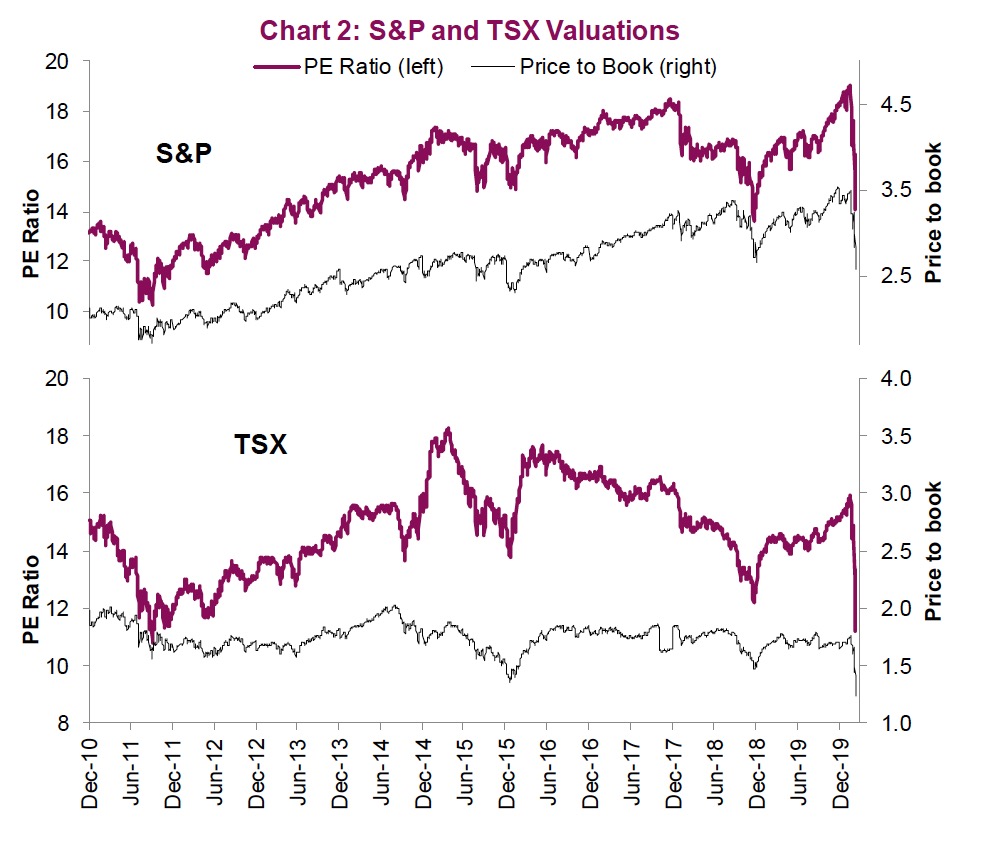
Unknowns and uncertainties have already transitioned into share prices with valuations reaching very depressed levels in some pockets. The Canadian banks are trading at 7.6x earnings. If you agree the earnings may be at risk, how about a dividend yield of 5.8%? The S&P 500, which was trading over 19x earnings in mid- February, is now trading at 14x. Again, if you don’t buy the earnings as they are more uncertain, the price-to-book for the S&P is now 2.7x (Chart 2).
There is no shortage of anecdotal information floating around on the COVID-19 pandemic. While it could very well be the most challenging health event in decades, the hysteria continues to escalate. Lessons continue to be learned on how to deal with this pandemic and action appears to be taken at an increasingly rapid pace. Testing is becoming more widespread, sporting events cancelled, offices are sparsely populated as social distancing becomes the norm.
It is very difficult to even guess the various scenarios that could eventuate. China ignored the problem for months then embarked on highly aggressive measures. Now, active cases are on the decline there. The virus was clearly spreading in Italy before being detected and aggressive measures implemented later. In contrast, Korea embarked on strong measures very quickly and is starting to see active cases plateau. Taiwan has so far largely avoided the virus, utilizing isolation and location tracking via cell phone to see who an infected person may have contacted. It’s extremely difficult to tell how widespread the virus is in the U.S. given relatively limited access to testing. Other countries, such as Canada, could very well be ahead of the curve with protocols developed during SARS. Our geographic distance from the epicenter could also work to our advantage. Still, it is anyone’s guess.
The market will likely get over the virus long before we as individuals do. For instance, given the market drop over the past three weeks with all the news of virus numbers, deaths and cancelled sporting events, among other developments, it may even now be pricing in some pretty dire news. If the news comes in worse, market goes down; if better, market goes up.
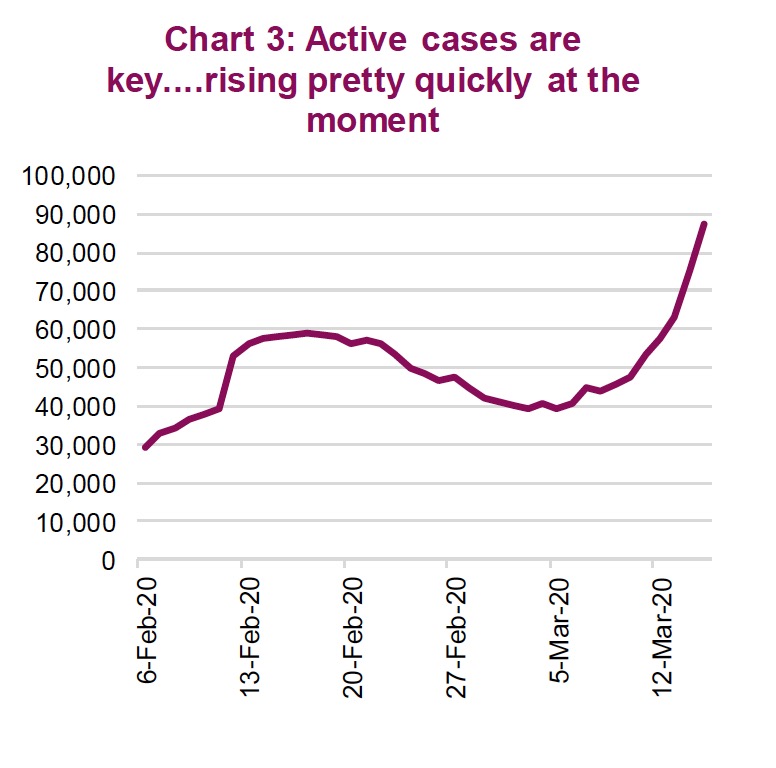
We continue to be keenly focused on the trajectory of worldwide active cases, which continue to rise (chart 3). The slope is key – a steepening is bad and a flattening is good. Given 11K net new active cases on March 14 and 12k on the 15th, this is not encouraging. But the daily information is noisy given batches of testing.
Economics & earnings
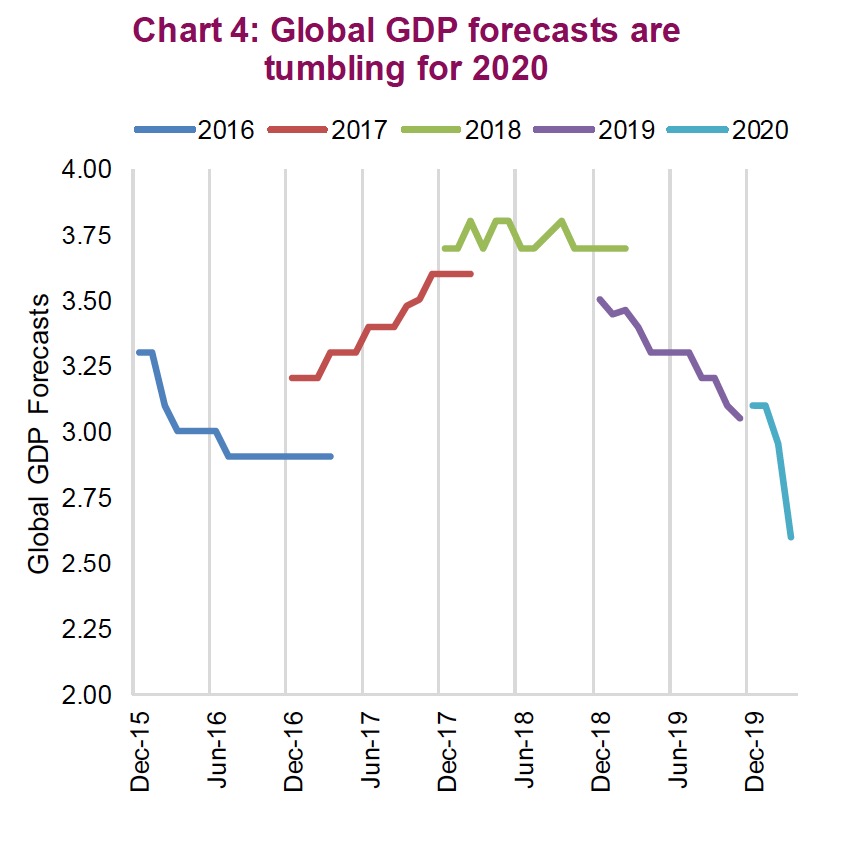
It will not surprise anyone when the economic data begins to soften around the world in the coming months. The impact on behaviour is already starting to show up in the survey data, and the hard economic data will follow. Chart 4 is the consensus forecast for global GDP. We are accustomed to seeing these forecasts revised lower as the year progresses, but the 2020 forecast is falling very fast. There may be some reprieve from inventory stockpiling, but this will be a minor positive. We are likely looking at negative GDP growth for many nations.
Employment data will take a hit too in the form of rising unemployment. This could start to cause other economic dominos to start falling and turn a temporary disruption into a full-blown recession. Or, it won’t.
One positive aspect is that policy has certainly been supportive and continues to be so. After the big drop on March 12, a slew of central banks and governments announced both easing and fiscal stimulus plans. On March 13, the Bank of Canada cut the overnight lending rate by half a percentage point to 75 basis points (bps). This is on top of the 50bps cut last week. The Fed acted again over the weekend cutting the Fed Funds rate from 1.25 to 0.25 (or effectively zero as this is the upper band) and $700B of QE. Not sure if this is QE4 or 5, its confusing. These efforts will soften the economic blow and help markets operate.
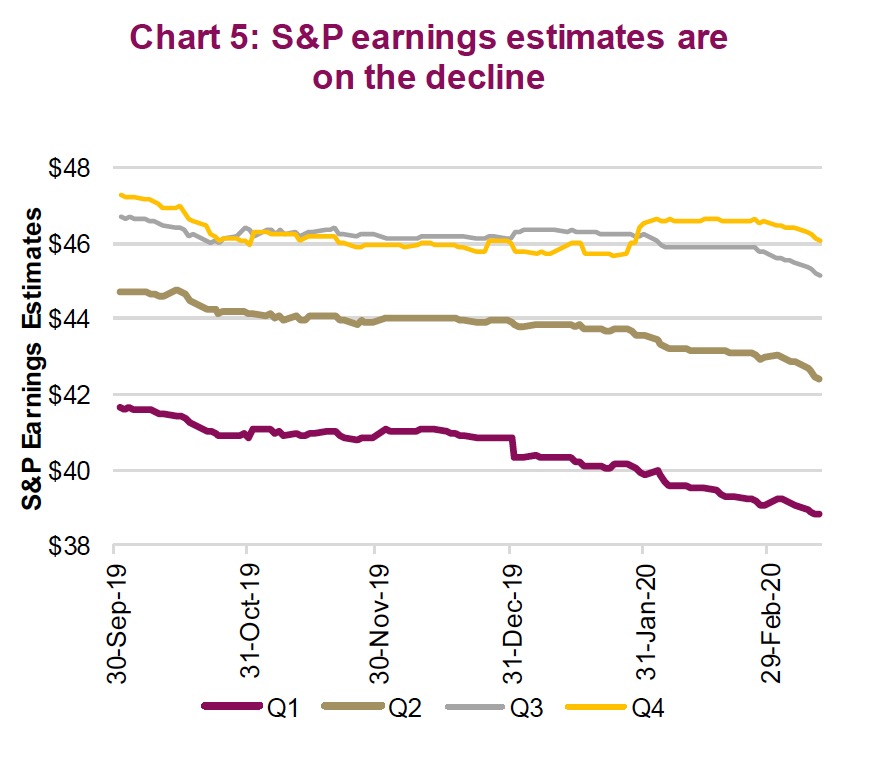
Earnings estimates have started to come down and we would expect this to accelerate (Chart 5). Often, analysts don’t change estimates on the fly and will wait for the Q1 earnings season before adjusting. This will cause a sizeable drop in estimates during the month of April.
Portfolio implications
We would like to believe the worse of the equity market drop is over, but nobody knows for certain (markets look to be opening down almost 10% this morning). There have been more capitulation signals this past week including a VIX spike to over 70 and the percentage of investors that are now bearish is over 50%. This is encouraging. However, the path forward is full of uncertainties, from the trajectory of active COVID-19 cases, how much economy growth is curtailed and the subsequent impact on company earnings.
After a 25% decline, perhaps much of the bad news is priced in. But then again, this market has punished anyone who previously thought it was time to buy. The one day drop on March 12 – representing a 30+ year record – bodes well for future returns, as do bond yields picking back up. Time will tell.
Special Market Insight – What happened to bond ETFs?
While selling has been rather frantic over the past month, for the most part it had been rather orderly. That started to change last week, not in the equity market but in the bond market, culminating in some material mispricing on March 12. Normally, the corporate bond market prices efficiently with banks and other financial participants providing liquidity to facilitate trading. But in times of stress, sometimes that liquidity dries up and this can create a liquidity mismatch between some vehicles (ETFs) and their underlying holdings.
Late last week, global bond market liquidity dried up at an alarming rate. With government bond yields tumbling on the potential economic recession triggered by COVID-19, many firms that provide liquidity took a big step back. These developments had serious roll-on effects impacting everything from municipal bonds, mortgages, corporates, and even government bonds. This also made it very difficult to know the true price of many bonds for the ETF market makers.
This uncertainty around true pricing and volatility caused market makers to charge a larger spread on creating or redeeming ETFs comprised of fixed-income securities. It was on March 12 that the underlying illiquidity of the bond market caused problems for what is viewed as the highly liquid fixed-income ETF market.
One of the mechanisms that keeps an ETF trading close to its Net Asset Value (NAV) is arbitrage. If an ETF trades below its NAV, a profit-motivated trader can buy the ETF (at a discount) and the basket of bonds that the ETF holds (at close to NAV). This helps close the discount and gets the ETF back to NAV. BUT, if some of the bonds are not easily priced because bond desks have stepped away, well, that makes it a lot harder. This contributed to the big discounts to NAVs for many bond ETFs on March 12 – mainly those with corporate bond allocations but also some government bond ETFs. For example, on March 12 the Vanguard Short Term Bond ETF (VSB), which tracks a Barclays index of the short-term Canadian bond index, fell 5.55% while the index it follows fell 0.17%.
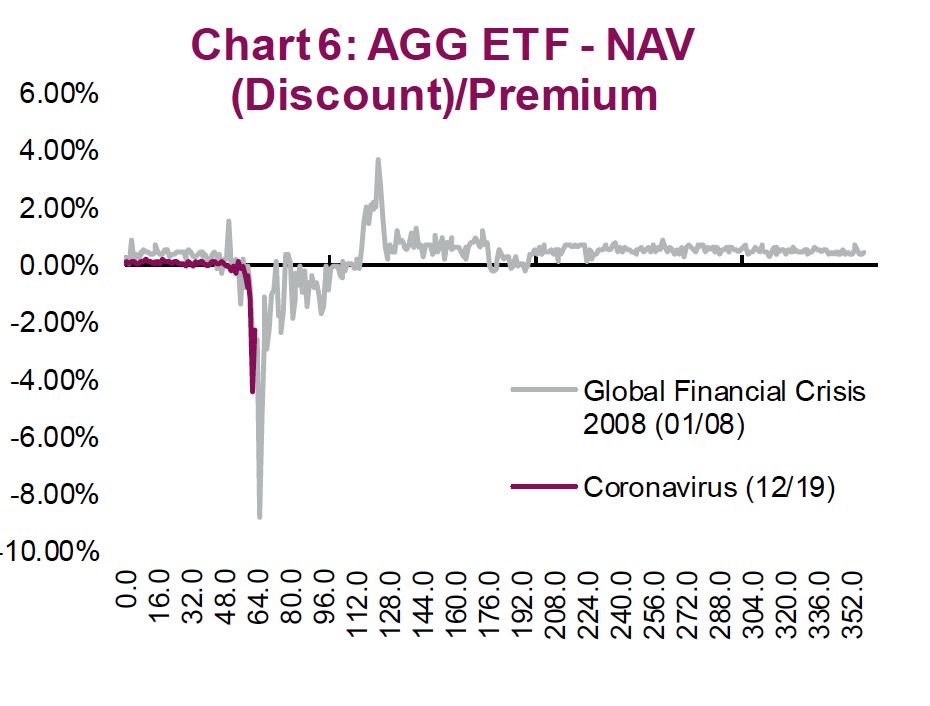
Chart 6 is a large U.S. bond ETF that is about 50% government, 25% corporate and 25% mortgages. Its discount to NAV dropped to 4% on Thursday as pricing many of the underlying assets proved difficult. Clearly reminding investors that during times of stress, miss-pricings abound. The good news is that across all these bond ETFs in Canada and the U.S., this discount was reduced on March 13 – some completely, some partially.
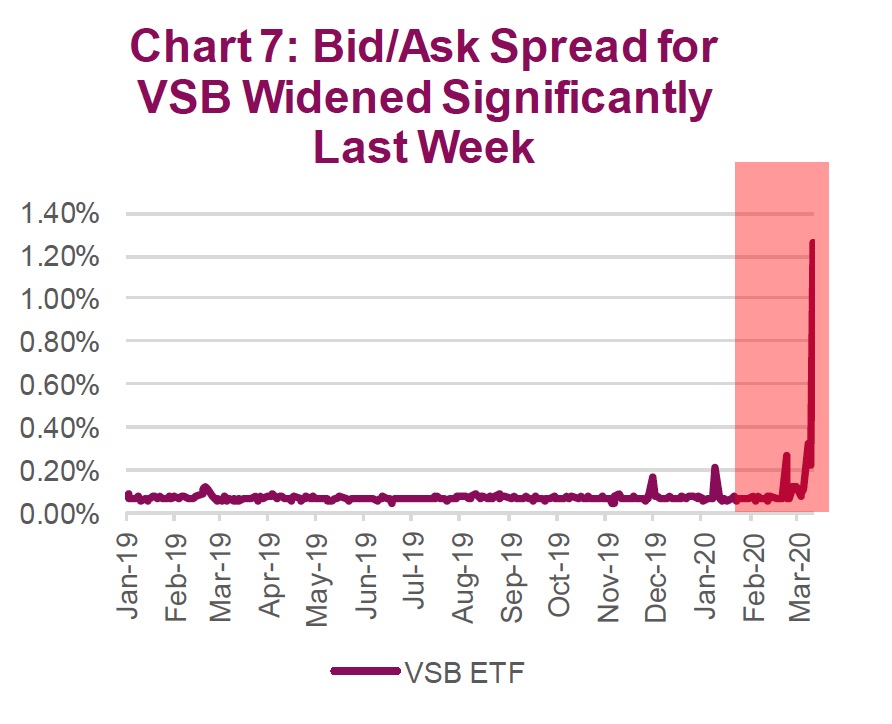
There are many strange things going on the market at the moment. Among them is that fact that 10-year U.S. government bond yields fell to 0.31 bps last week then rose to finish at 0.96 bps, and is poised to start this week at 0.69bps. This is indicative of too many buyers, then too many sellers. Situations like this feed the uncertainty and this has been contributing to a rise in bid-ask spreads as well along with uncertain pricing. Again, this is driven by the uncertainty in pricing of the underlying holdings for some ETFs. We saw the bid-ask spread average 194bps on March 13 for VSB, compared to a 7bps average in 2019 (Chart 7).
There is also the consideration that bond ETFs are a window into the underlying market of the securities they hold, which are not being traded or priced as frequently. This brings risk and opportunity to trading these ETFs during periods when underlying asset pricing may be inefficient or lacking. We would suggest you ignore a day or two of mispricing. The fact is, if you owned the underlying bonds themselves, the result would be the same as if the corporate bond market pricing is out of whack. You may just notice it more with the ETF.
The gap will close as the market inevitably returns to normalcy and as those that are skilled arbitrageurs swoop in and close the difference between the NAV and ETF value. If last week is the new normal and stock markets move down 10% one day and up 10% the next, I owe you a soda or a case of hand sanitizer.
*****
.
Source: All charts are sourced to Bloomberg L.P. and Richardson GMP unless otherwise stated.
The opinions expressed in this report are the opinions of the author and readers should not assume they reflect the opinions or recommendations of Richardson GMP Limited or its affiliates. Assumptions, opinions and estimates constitute the author's judgment as of the date of this material and are subject to change without notice. We do not warrant the completeness or accuracy of this material, and it should not be relied upon as such. Before acting on any recommendation, you should consider whether it is suitable for your particular circumstances and, if necessary, seek professional advice. Past performance is not indicative of future results. The comments contained herein are general in nature and are not intended to be, nor should be construed to be, legal or tax advice to any particular individual. Accordingly, individuals should consult their own legal or tax advisors for advice with respect to the tax consequences to them, having regard to their own particular circumstances. Insurance services are offered through Richardson GMP Insurance Services Limited in BC, AB, SK, MB, NWT, ON, QC, NB, NS, NL and PEI. Additional administrative support and policy management are provided by PPI Partners. Insurance products are not covered by the Canadian Investor Protection Fund.
Richardson GMP Limited, Member Canadian Investor Protection Fund. Richardson and GMP are registered trademarks of their respective owners used under license by Richardson GMP Limited.
Copyright © Richardson GMP


