by Harry G. Katica, Saut Strategy LLC
September 20, 2019

The Coin Toss
Before a football game, the Referee brings the two Captains out to the 50-yard line and flips a coin to determine who gets the ball. Heads or Tails; take your pick. Each choice has exactly a 50% chance of success. Statistically speaking, it’s not worth a bet. In the long run, you will get back exactly what you invested. Yet many players pick one or another every time, based on superstition. They will claim to have an edge.
The stock market also rewards those who gain an edge. Most professional investors think they have one. Why even be in the business if you can’t beat a dart board? I spent my entire 30-year career as an equity analyst trying to figure out what makes stocks move. I’d develop a model. Make a forecast. Plug in a few assumptions. Evaluate risk and reward. Sometimes I got it right. Sometimes I didn’t. It’s all about probability. If I had a slam dunk a few times a year, I was lucky.
Sometimes, it’s even better to be dead wrong. Just recognize it soon enough. Think of how many times you bought a stock, only to watch it go down the next day. How did the market know you finally got jealous and bought that tip from your neighbor? Oftentimes, it was an emotional decision, not rested on sound analysis. But how many times did you flip that early loss and go the other way. It’s not easy to admit that you were wrong. Trust me. But it can be profitable.
The goal, of course, is to get it right. In order to do so, an investor must put together a thesis for an investment. What needs to happen for a stock to go up? Analysts and Portfolio Managers try and figure this out every day. Come up with a thesis with one or two good reasons, go down to the morning meeting, and make a call. You know very quickly how well it will play on the road.
Rarely will you be 100% right, unless its Inside Information. Before 2000, it was possible to get an inside nugget or two. That edge is gone. The best call it right about 67% of the time, but that takes something special. The stocks must be held for 52 weeks. It’s also best to make these picks around the end of December. Pick 15-20 to get the math right.
Believe it or not, many professionals are right less than half the time. At least, it seems that way. I suspect they would be timelier if it didn’t take them so long to act on new information. They are often out of the office. In addition, they need to confirm their models with management, which can take another few days. There are other reasons. The Portfolio Managers know this. They just want you to have a good call a few times a year. It’s better you didn’t put it in a report. Their edge will be gone if you tell someone else.
As a Contrarian investor, it’s challenging to find a sustainable edge. But it’s possible. Here’s my thesis. Stocks bottom on bad news, shortly after the momentum investors have departed. The slope of the trend (RSI, Stochastics) points straight down, triggering that nightmare of a big loss. Volume surges as all the weak owners jump ship. Eventually they are all gone. The stock settles down to take a nap that could last indefinitely. In the better situations, the valuation is okay, cash flow and balance sheet are strong enough to survive a downturn. Then wait.
Sensing a period of inactivity, the first short covers. He doesn’t want to wait for the good news. It could be too late. That first blip triggers a few others, and before you know it, there’s a rally. No news. That’s how the cycle starts. Shortly thereafter, the next quarter is announced. Earnings were better than the tentative guidance provided three months ago. Business is improving. We were wrong to assume the worst. Those shorts who did not already cover now have to chase. The computers know this and push the stock up even higher. That’s the theory.
A market cycle works much the same way, except with a twist. There’s a lot more emotion involved. When you make bets with trillions of dollars, riding on your call for the economy, there is a lot of pressure to be right. You might become more risk averse, waiting for the good economic reports to lift your spirits. There will likely be others making the same call. You are within “the consensus”. The problem is you are a day late. The traders made that move yesterday, when those computers made another polarity flip.
In order to get there early, you must be watching when the market goes into total meltdown. When a pullback hits 5%, investors start to get nervous. The nervous nellies sell at the first sign of trouble. When a big stock decline is the lead story on the national news, investors start to panic. Put risk together with a specific date, like a Fed meeting, and you have the ingredients for a selloff and a buying opportunity. Not many investors enjoy this tactic.
Which brings us to Wednesday’s Fed meeting. In last week’s report, I laid out the Bear case for the S&P 500. If the case held water, interest rates would have been left unchanged, and Powell would have said something to disappoint the market. Earlier this week, it looked like a real possibility. Retail Sales (last Friday) and Industrial Production (Tuesday) were better than expected. The CME’s Fed watching tool went from an 80% chance of a 25 bp rate cut to 50% in about a week. If ever there was a time for Powell to wait and see, it was this week. Let the market know that the economy is fine. Show the President you can be independent. See if the market can handle it.

Source: CME Website
After a burst of optimism Tuesday, the SPX started to rollover overnight. It would be prudent for traders to step back and wait for the news to clear. No sense taking a quick loss. Stocks drifted down all day. At 2pm, the news came in. Rates down, but the language created uncertainty about future cuts. The SPX gave up a quick 30 points, until the Q&A session. If traders sense weakness in Powell’s comments, they would torpedo the market immediately.
This time, Powell provided investors with the goldilocks treatment. Just enough promise of rate cuts. A little help for the repo market. Upbeat about the economy. It seemed the work. The futures bounced off 2980 and went straight to 3011, relatively unchanged for the day. At a time when sentiment was shaky, stocks made a successful re-test. If the economy hangs in and rates calm down around current levels, it could push back to all-time highs.

Sector Spotlight

Utilities are the gift that keeps on giving. Since early 2018, roughly the start of this 18-month trading range, the sector has substantially outperformed the SPX with little of the volatility. Who would have guessed rates would be cut in half during the time, with the 10-Year now yielding 1.8%, down from 3.2% last October? With the door still open to future cuts, investors still seem comfortable riding out the economic turbulence in defensive groups.
XLU - $64 Range - $59-$64. Point of Control - $61.00. Support - $62.50. Resistance - $64.00
Real Estate has been the other sector benefitting big from lower interest rates, although it sits below its high made in early September. The leading groups have been Industrial, Residential, and Health Care. On the other hand, the Retail, Hotel, and Office – generally the more economically sensitive areas – have stalled out.
XLRE - $40 Range - $37-$40. Point of Control - $38.00. Support - $38.50. Resistance - $40.00

Energy was the best performing group over the last week, increasing 1.5% versus a virtually flat S&P
500. All the gains came on Monday, as markets responded to the weekend attack of oil infrastructure in Saudi Arabia. The sector proceeded to fall the next three days until it traded where it was last week. This has been the story for Energy all year. With oil price gyrating with the trade news, each rally has been met with selling. It will be a few more weeks until the group quiets down from the artificial boost. In the meantime, I am looking elsewhere for trades.
XLE $62 Range $56-$64. Point of Control $63. Support $60.00. Resistance $64.00.

Materials have been unusually strong this week, after falling nearly 2% on Monday. This performance follows a strong showing since late August, when investors toyed with a more aggressive easing by the Fed. Surprisingly, many stocks in the deep cyclical Chemical industry came close to annual highs in September. I suspect short covering is possible given the pin action. Earnings season starts in a month. There could be some disappointments as recent performance has been driven more by macro events than fundamental performance.
XLB $58 Range - $55 to $59.50. Point of Control is $58. Support is $58.00. Resistance at $59.

Transportation stocks continue to be more volatile than the overall market, as macro events have caused unusually uncertainty in the bond market. Further Fed easing in October is down to about a 50% probability, and many portfolio managers had to erase that extra cut they expected before yearend. With the global economy still sputtering and oil prices going higher, it would be understandable for the group to consolidate below recent highs for a while. That said, I bought some FDX today, after the disappointing Q. Is it possible that a resolution to Brexit could provide a spark? IYT $189 Range $175-$195. Point of Control $182.50. Support $191. Resistance $184.

Industrials were flat over the last week, as investors became less confident about the Fed action on Wednesday. Strong Retail Sales and Industrial Production numbers could have provided an excuse to do nothing, although the post-meeting press conference threw water on the idea of aggressive easing from here. Markets are now looking to Brexit as being the next potential catalyst for the cyclical sectors.
XLI $79 Range $73 to $79. Point of Control $77. Support $77. Resistance $80.

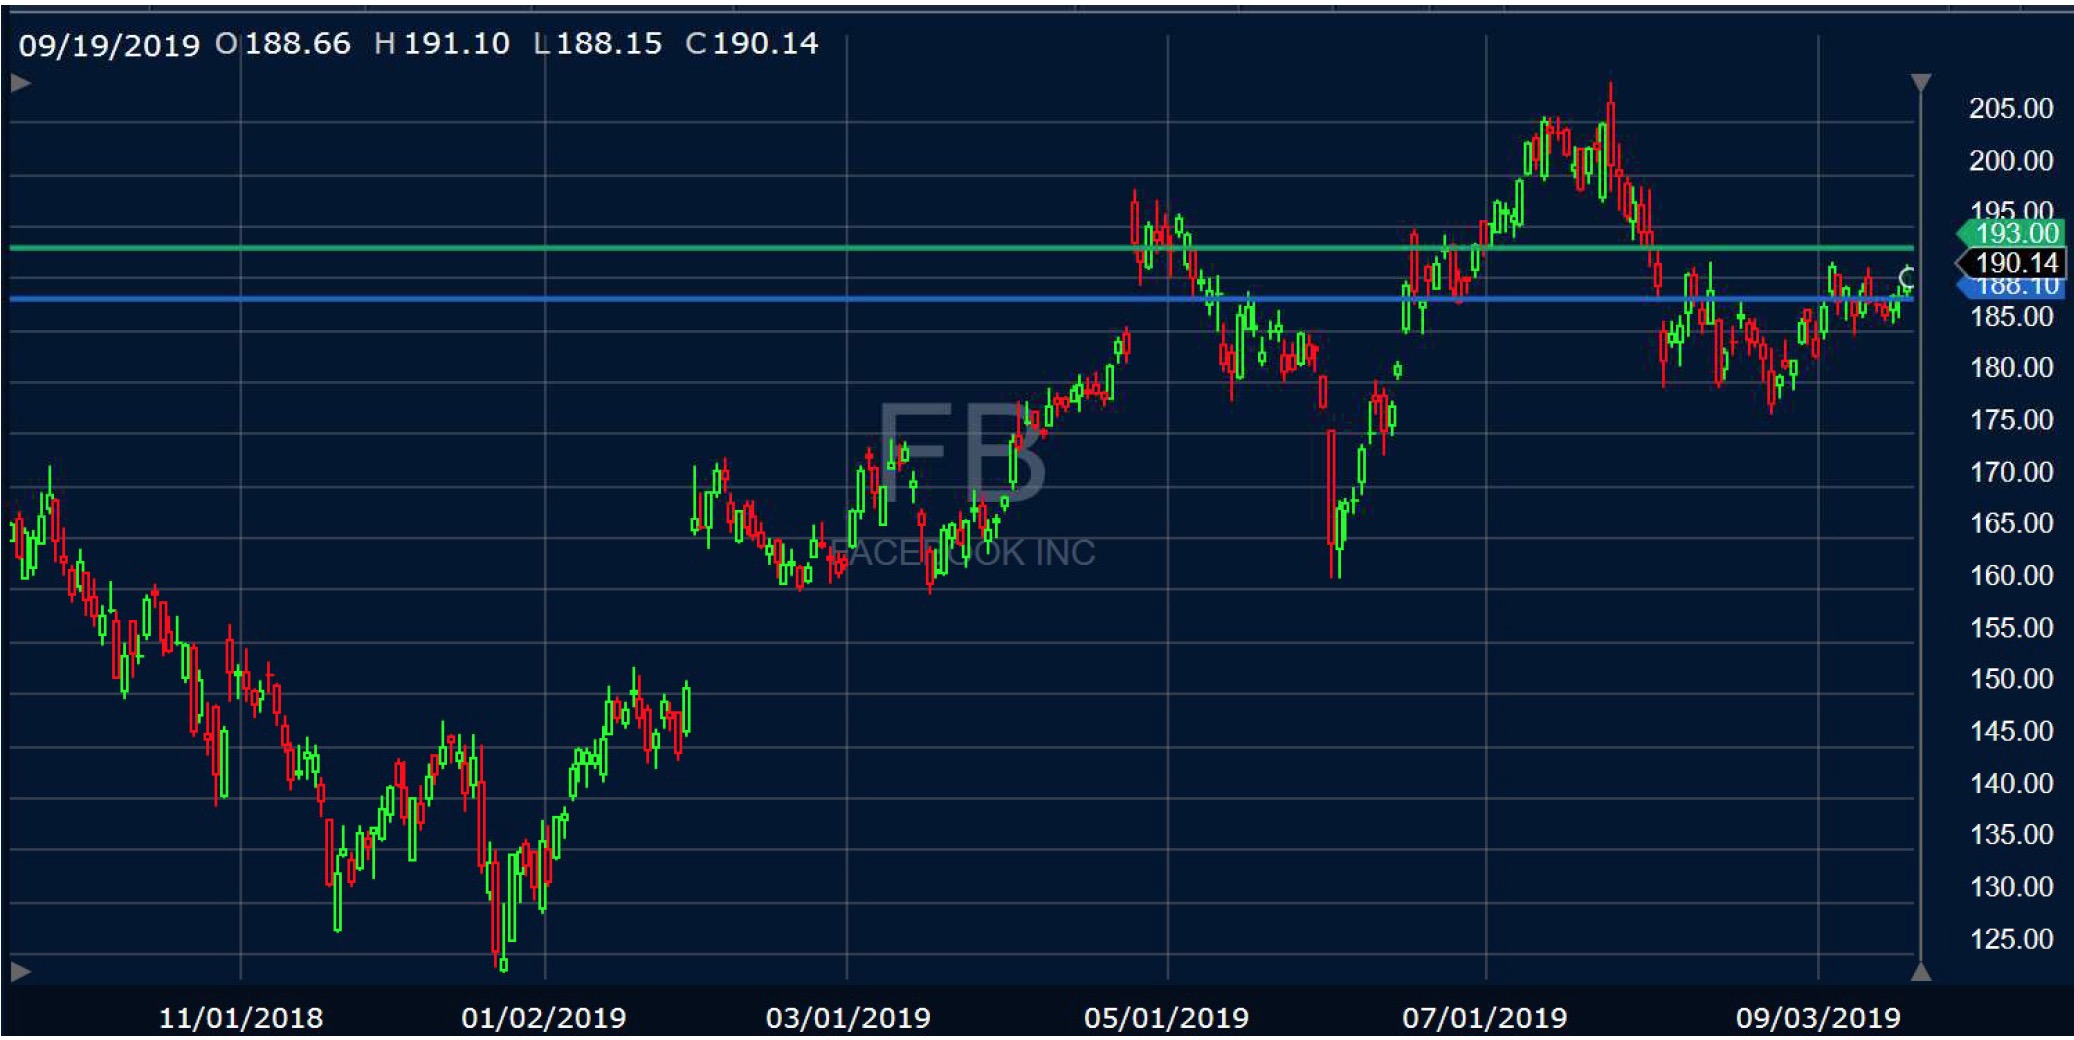
Communication Services fell 0.24% in the past week and underperformed the SPX. The big Social Media names (FB, GOOG, and TWTR) continue to face a regulation overhang. Many investors expect new legislation, generally protecting privacy rights. These stocks actually sailed through the August volatility box and experienced modest volatility. At a time when cyclicals are losing appeal, the time might be right for a rotation back into this group. TMUS is closing in on S and should be positioned for an upturn. Entertainment stocks aren’t so lucky. Streaming video services are proliferating, possibly leading to extra competitive. Bad news for NFLX and DIS
XLC $51 Range $48-$52. Point of Control $49.50. Support is $49.50 Resistance at $52.00.

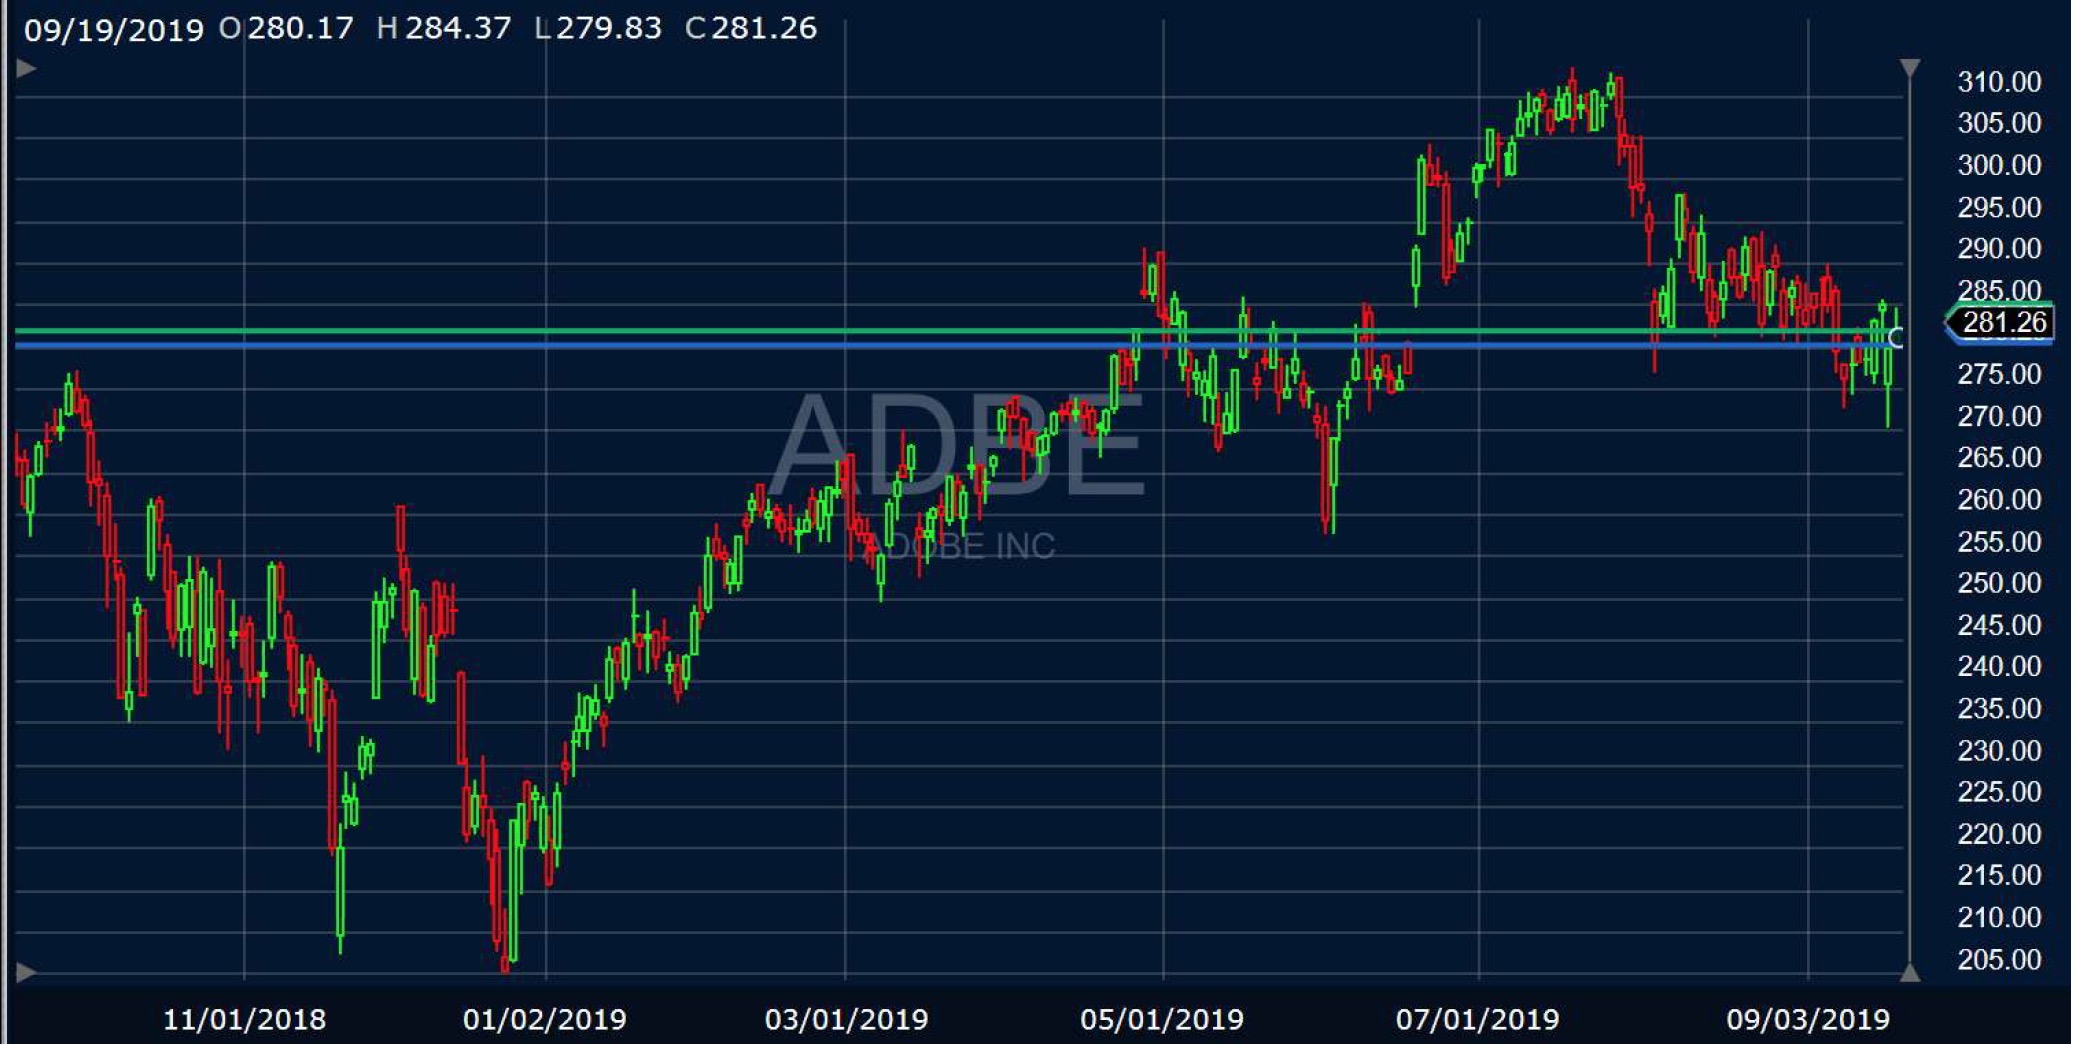
Technology has been flat over the last week, as investors pondered the likelihood of further easing. The verdict is in, and investors appear to be moving away from cyclical industries like Semiconductors (NVDA, QRVO), IT Services (MA and V), and Communications Equipment (CSCO). Software came out of the Fed meeting very strong and picked up momentum Thursday with the
$40 billion stock buyback from MSFT. Some of the Cloud names got a boost - CRM, ADBE, BKI XLK $81 Range $76-$83. Point of Control $79. Support $80.00. Resistance $83.00.

Financials were up 1.5% since last Thursday, helped by a shortage of bonds of all things. Banks had to pay up to borrow short-term in the repo market, a technical issue addressed by the Fed this week. Not all investors knew about this artificial boost and lifted the sector anyway. Despite the decline in rates this week, most stocks remained in a trading range until Wednesday. After the Fed comments, the sector rose with the overall market until 11 am Thursday, when the stocks turned down after the Bank of England held rates steady. Like Energy, I don’t like exogenous shocks in the middle of the night. I would rather be short the sector for the next week.
XLF $28 Range $26 to $28.50. Point of Control $27.00. Support $28.00. Resistance $28.50.

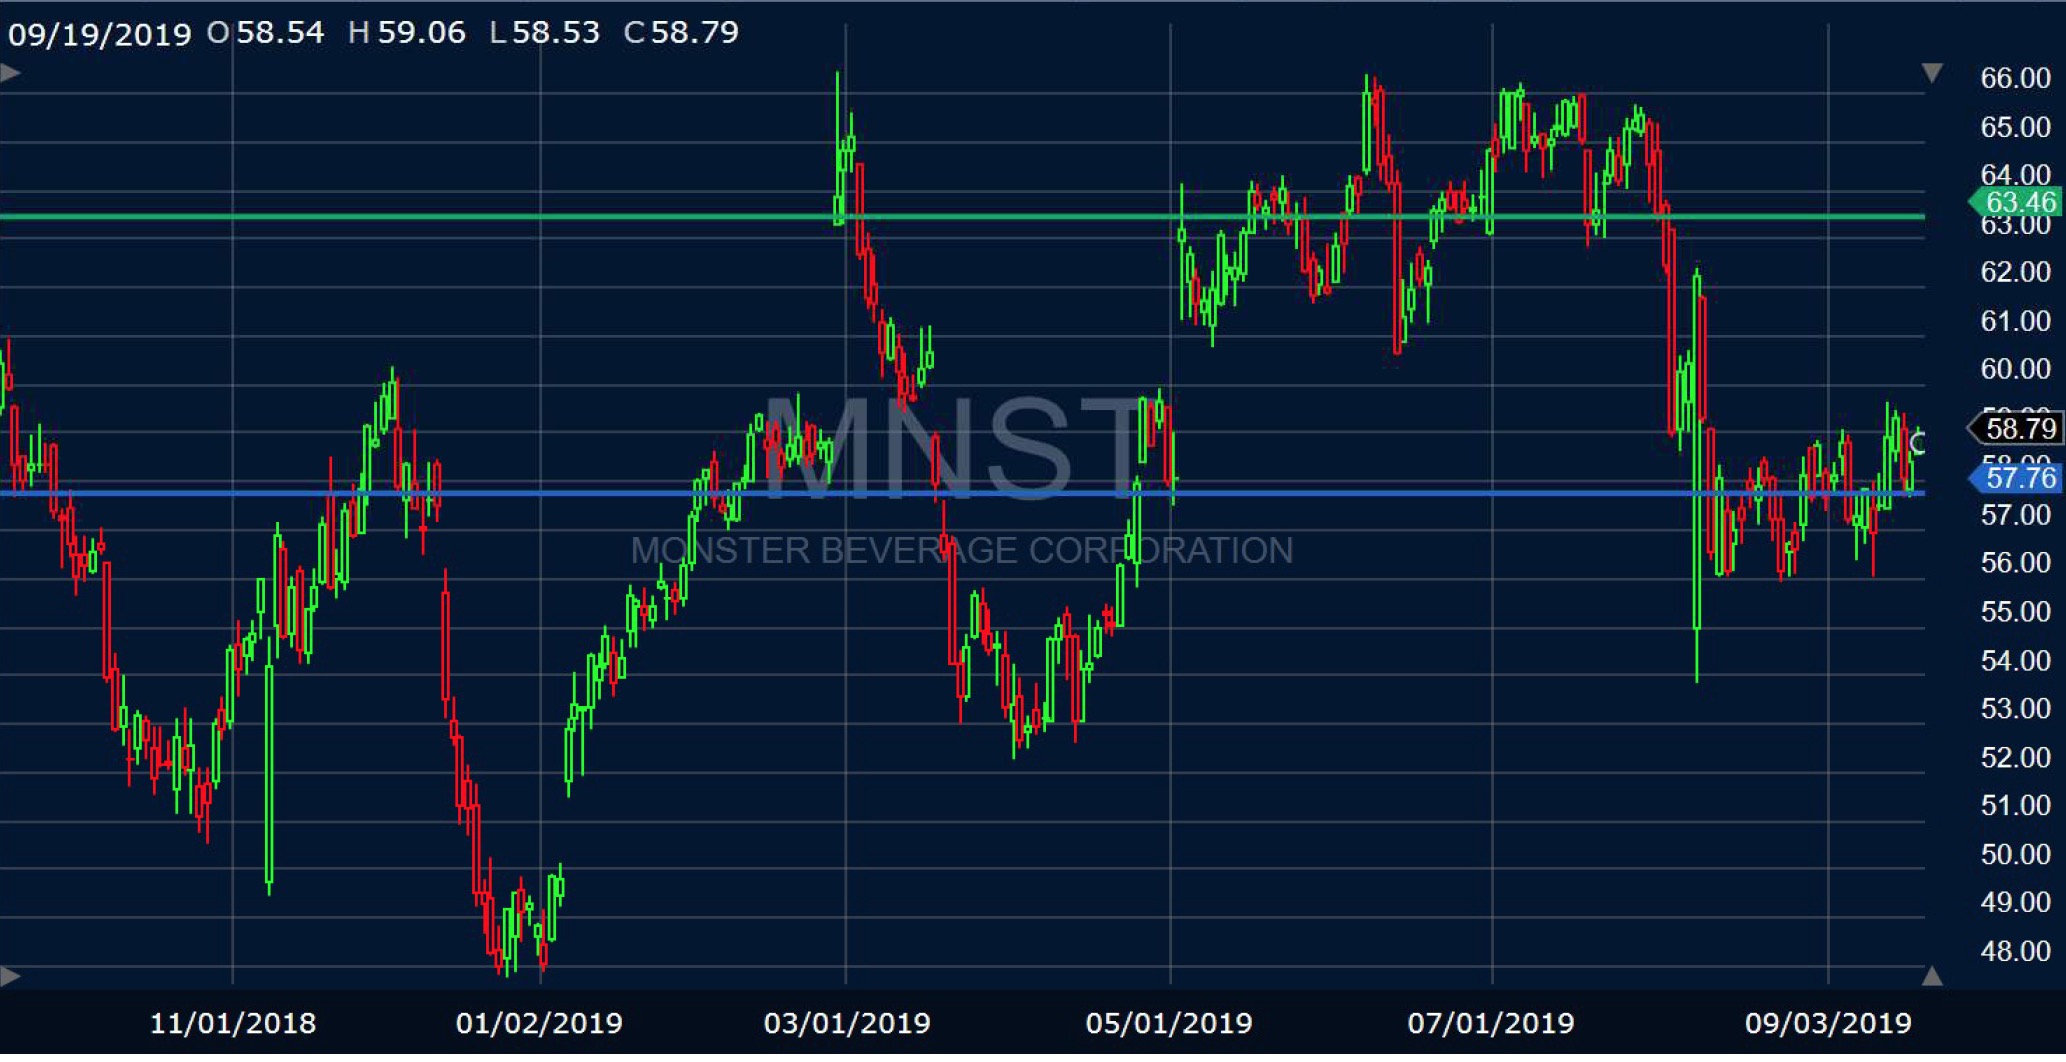
Consumer Staples may be the big winners through the end of the year. With the economy muddling through and lots of uncertainty remaining, the sector has provided a safe harbor all year. Names like WMT, COST, PG, KO, and PEP sound pretty good as we enter what could be a dicey earnings season. MNST and KDP are two smaller cap names that are in the early stages of a turnaround.
XLP $61 Range $58-$62. Point of Control $59. Support $60. Resistance at $62

Healthcare fell 0.24% in the last week, reflecting ongoing efforts to pass legislation to limit drug pricing and increase billing transparency. Nothing much has happened with these efforts, though it always plays well on the Presidential campaign trail. It may be some time before these issues go away. In the meantime, they will provide trading opportunities for those paying attention. The sector did especially well after out of the Fed meeting, as investors seemed to move away from the cyclicals.
XLV $92 Range $89-$93. Point of Control $91. Support $89. Resistance $93.


Consumer Discretionary stocks fell 0.45% in the latest week, as investors rotated away from the cyclical recovery story. Though the Fed cut rates, they continue to be data dependent and would not make any promises for future meetings. This news undercut the consumer cyclicals, which have been anticipating further stimulus. Particularly hard hit were the Autos, which benefit from low rates and plentiful credit. Even Homebuilders, which have been one of the stronger groups all year, will likely need still lower rates to keep up the strong performance.
XLY $122 Range $114-$124. Point of Control $119. Support $121.00. Resistance $124.00.