
Although recession fears have eased over the last week, and bears have given way to bargain hunters, world stock markets have remained choppy as corporate earnings have been mixed and the future of global trade remains uncertain. It seems that for every piece of good news, there has been a piece of bad news, particularly when looking at the results that have been coming out from US retailers and Canadian banks, keeping investors cautious.
While results from these sectors are scheduled to continue to roll out over the next few days, the main focus for investors is likely to shift back to trade and monetary policy. The US Federal Reserve Board is holding its annual Jackson Hole symposium starting on Friday, a forum that the Fed has used to signal shifts in monetary policy in the past.
Fed Chair Powell’s Friday speech could attract particular scrutiny from investors trying to figure out if the Fed’s recent rate cut was a one-and-done proposition or the start of a larger program of multiple rate cuts. The latter would raise questions about the health of the US economy and suggest an uncertain outlook for corporate earnings despite positive comments on the economy coming out of the White House.
Meanwhile, trade could top the agenda at this weekend’s G-7 summit and meetings between leaders being held around that event. This is the first big summit for new UK PM Johnson and how he relates to US President Trump relative to EU leaders could have implications for Brexit and other trade files that could influence investors’ outlook for the global economy and resource demand.
In this week’s issue of Equity Leaders Weekly, we review what the Sector Scopes feature in SIACharts is telling us about equity market conditions and sector rotation. We then take a closer look at recent changes in the relative relationship between real estate and bank stocks.
Sector Scopes Update
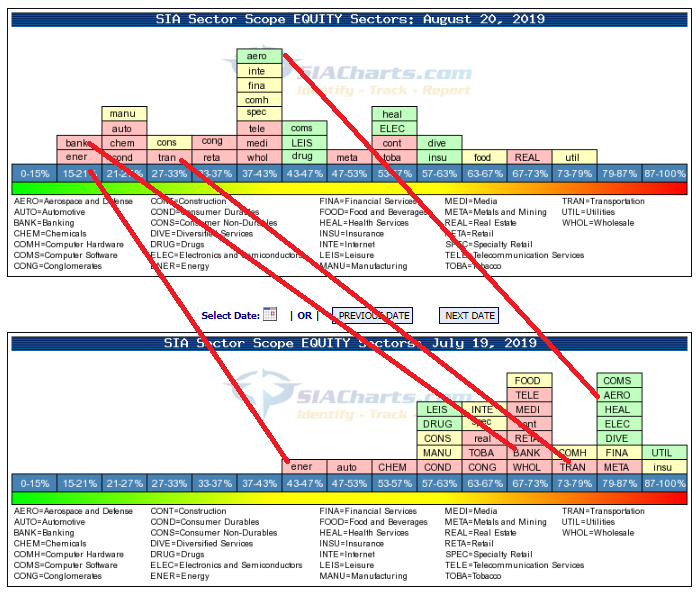
The Sector Scopes feature, which can be found in the Markets tab of SIACharts, tracks the percentage of stocks on a bullish technical signal for 31 industry groups. Analysis of the Sector Scopes not only provides insights into capital flows between groups but also into broad equity market sentiment. Higher readings (rightward) suggest investor confidence/exuberance, while lower readings (leftward) suggest investor concern/pessimism.
A month ago (bottom chart), the majority of sectors were clustered on the right half of the table suggesting that investors were generally bullish and that market was at risk of becoming moderately (not extremely) overbought. The market correction that ensued earlier this month after the Fed cut interest rates has eased overbought conditions (top chart) as many sectors have shifted leftward. The distribution has widened across the spectrum suggesting neutral (not oversold) market conditions.
Among groups, the sectors that were less impacted by the selloff and have remained on the right-hand side include interest-sensitive sectors such as Utilities and Real Estate, and defensive/Staples sectors like Food and Health. Groups that saw investors turn more pessimistic and staged large leftward moves include areas exposed to the risk a trade war could negatively impact demand and commodity prices including Energy, Aerospace, Autos, and Transports. One key sector that diverged from its industry group (interest sensitives/financials) and staged a big leftward move was the Banks. We’ll look at this more closely in the next section.
BMO Equal Weight REITs ETF (ZRE.TO) Versus BMO Equal Weight Bank ETF (ZEB.TO)
A large divergence has emerged between banks and other interest sensitive groups recently. Interest sensitive stocks generally tend to do better in times of falling interest rates as we are in currently. It comes as no surprise then, that in a dovish rate environment, interest sensitive groups like Utilities, Real Estate, and Insurance are among the groups with the highest bullish percent readings. Banks, on the other hand, are near the lowest.
The reason for this appears to be that groups like Utilities and Real Estate are physically tied to the North American continent. Banks, on the other hand, are more sensitive to swings in the North American/Global economy (through exposure to business loans – and loan loss provisions have been rising) and global markets (through their brokerage/wealth management/investment banking/trading operations). In this case, the relative weakness in Banks compared with other interest sensitive groups suggests investors remain cautious about the outlook for the global business environment.
The relationship between banks and non-bank interest sensitives (using real estate stocks as a proxy) has changed significantly this year. Between 2013 and 2017, real estate underperformed relative to banks and then between late 2017 and late 2018 the two groups were in balance. This year, real estate has started to outperform banks, particularly surging upward on a relative basis since July.
This change has been due to the two sectors moving in opposite directions. The BMO Equal Weight REITs ETF (ZRE.TO) recently broke out to a new high and is on a bullish Double Top pattern with a bullish SMAX score of 9. In contrast, the BMO Equal Weight Bank ETF (ZEB.TO) recently broke down and is on a bearish Double Bottom pattern with a bearish SMAX score of 4.

SIACharts.com specifically represents that it does not give investment advice or advocate the purchase or sale of any security or investment. None of the information contained in this website or document constitutes an offer to sell or the solicitation of an offer to buy any security or other investment or an offer to provide investment services of any kind. Neither SIACharts.com (FundCharts Inc.) nor its third party content providers shall be liable for any errors, inaccuracies or delays in content, or for any actions taken in reliance thereon.
Copyright © SIACharts.com