by Nelson Yu, AllianceBernstein
Figuring out how to use big data is the next frontier for the asset-management industry. Equity investors must have the right culture—and ask the right questions—to successfully integrate data science into research and investment processes.
Why Is Big Data So Important?
There’s a colossal amount of data available to investors today. For example, more than 8,000 US-listed companies produce quarterly 10-Q and annual 10-K reports, each hundreds of pages long. We’ve collected 675,000 of these reports that were filed over the past 26 years. Globally, companies also conduct about 20,000 earnings calls a year in English, each yielding detailed transcripts. And if you include non-English corporate documents from around the world, the data mountain mushrooms.
In theory, portfolio managers must pore over thousands of pages of data to fully gauge the risks and opportunities that a company faces. Practically speaking? It isn’t humanly feasible.
Data science offers a solution by applying machine learning and artificial intelligence (AI) techniques to process information. Yet even the smartest software requires human direction and expertise to translate data into investing conclusions.
Bringing Together Research Skills
Generating insights requires a broad set of investment skills. Large data sets must be crunched and combined with complex statistical and economic models. Investment organizations rooted in quantitative research may seem more attuned to data science but might not be equipped to make sense of the information.
Fundamental analysts can apply research intuition by asking the right questions needed to extract useful information from huge pools of data, but they may lack the technical skills to process it efficiently.
We’ve been introducing advanced big data techniques to tackle equity investing conundrums that couldn’t be solved by human researchers alone. In the following case studies, we aim to show how a hybrid approach drawing upon diverse analytical skill sets can help investment teams rise to the data challenge.
Case Study 1: Big Data to Study Airline Capacity Utilization
Question:How does additional capacity impact the pricing power of an airline?
Airfare pricing is extremely complex and opaque, which makes it very difficult for a transportation analyst to draw conclusions about an airline’s capacity, its pricing and ultimately its profitability. In 2018, we set out to mine big data in order to learn more about how airline capacity affects pricing power (Display).

We set our data scientists to overlay more 1 million rows of data from the Department of Transportation with a six-month lag with airline-reported data by route. We then matched quarterly fare and capacity data, consolidated the airlines and removed monopoly markets from the data set to focus on the effects of competition.
The study revealed two clear conclusions. First, airlines typically add capacity to routes with higher-than-average growth in passenger revenue per available seat mile (or PRASM, the industry measure of the profitability of a given route). Second, within four quarters, the increase in capacity tends to slow. This triggers a recovery in PRASM.
These conclusions were not academic. By gaining a better understanding of pricing dynamics, we developed a clearer view of the earnings potential of one of our holdings, which underpinned our conviction and allowed us to increase our position. What’s more, the research has enabled us to monitor real-time airline pricing more accurately, and we use these data to engage management in discussions about their plans for future route expansions.
Case Study 2: Identifying Risks in Corporate Filings
Question:Can changes in the MD&A section of 10-K statements help identify risk?
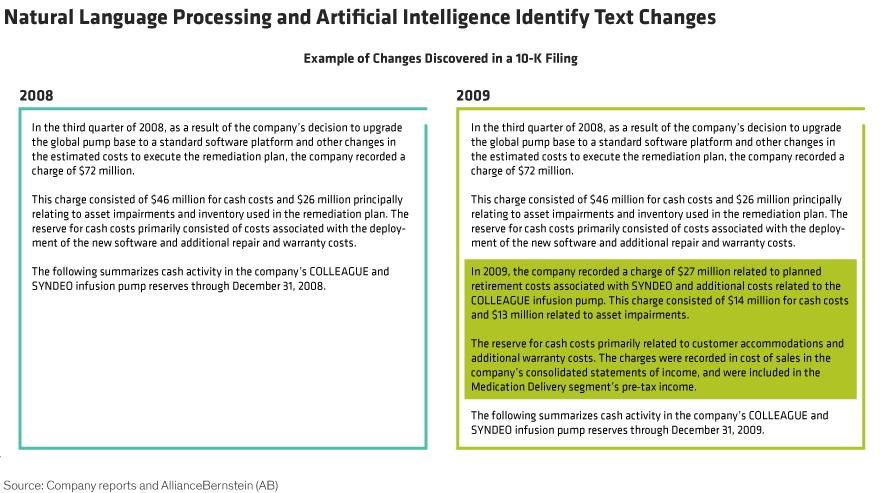
Corporate filings provide investors with a treasure trove of information. But with thousands of pages to decipher, how can you find what’s really important? We set out to identify potential risks in corporate filings by using NLP and AI to scour annual 10-K reports.
The logic is simple. In the management discussion and analysis (MD&A) section of a 10-K, most of the text doesn’t change much from year to year. By systematically and comprehensively finding sections that have changed, we may be able to discover potential risks earlier than others.
First, we scraped the website of the US Securities and Exchange Commission for corporate transcripts of S&P 500 companies since 1996. Then we parsed the MD&A sections and applied NLP to compare filings from year to year. Our system created a score to show how similar or different a report was from one year to the next. Fundamental analysts then reviewed the 10-Ks of companies flagged to validate the risks detected.

The conclusion? Shares of companies that scored low tended to underperform within the first three months after the report was released. Based on this analysis, a broader data-driven tool could be developed to help equity analysts gain an advantage in anticipating corporate changes that are likely to affect share prices.
Don’t Dismiss the Human Touch
These cases show the importance of closely integrating the data analysis function with investment teams and industry analysts. Given the costs involved, it’s important to choose the right projects, where data analysis can make the biggest impact.
Investment firms that address these challenges will do better at using data science to improve portfolio returns, in our view. There are no easy answers. But one guiding principle is clear: even with the most sophisticated AI, applying a human touch to the equity research process is the best way to turn big data into big investment insights.
Nelson Yu is Head of Quantitative Research at AllianceBernstein (AB).
Chris Hogbin is Chief Operating Officer—Equities at AllianceBernstein (AB).
The views expressed herein do not constitute research, investment advice or trade recommendations, do not necessarily represent the views of all AB portfolio-management teams, and are subject to revision over time.
This post originally appeared at the AllianceBernstein blog
Copyright © AllianceBernstein


