
by Brian Deese, Blackrock
Brian shares four charts illustrating the potential impact from climate-related risks on U.S. municipal bonds, commercial mortgage backed securities and utility stocks.
Increasing average global temperatures are boosting the frequency at which extreme weather events occur, as well as their intensity. These events, including hurricanes and coastal flooding, pose risks to portfolios that have been hard to pinpoint–until now. Our recent publication Getting physical showcases our new capability to analyze climate-related risks in portfolios down to the exact geographical location and asset level.
We draw on cutting-edge physical climate models from Rhodium Group as well as our own asset-level analysis to assess the risks to municipal bonds, commercial mortgage backed securities (CMBS) and utility stocks on a localized level across the United States. We shared some of our conclusions in the recent post What do climate risks mean to your portfolios? Looking for more? The four charts below nicely depict our findings, showing the potential impact from climate-related risks on these three markets.
Chart 1: Mapping the Damage
The Mapping the Damage graphic below illustrates how we can now gauge the likely overall economic impact of climate-related risks on a localized basis. The heat map visualizes the expected changes to gross domestic product (GDP) across the U.S. under a “no climate action” scenario, assuming ongoing use of fossil fuels. We find some 58% of U.S. metro areas will likely suffer annualized GDP losses of 1% or more by 2060-2080.
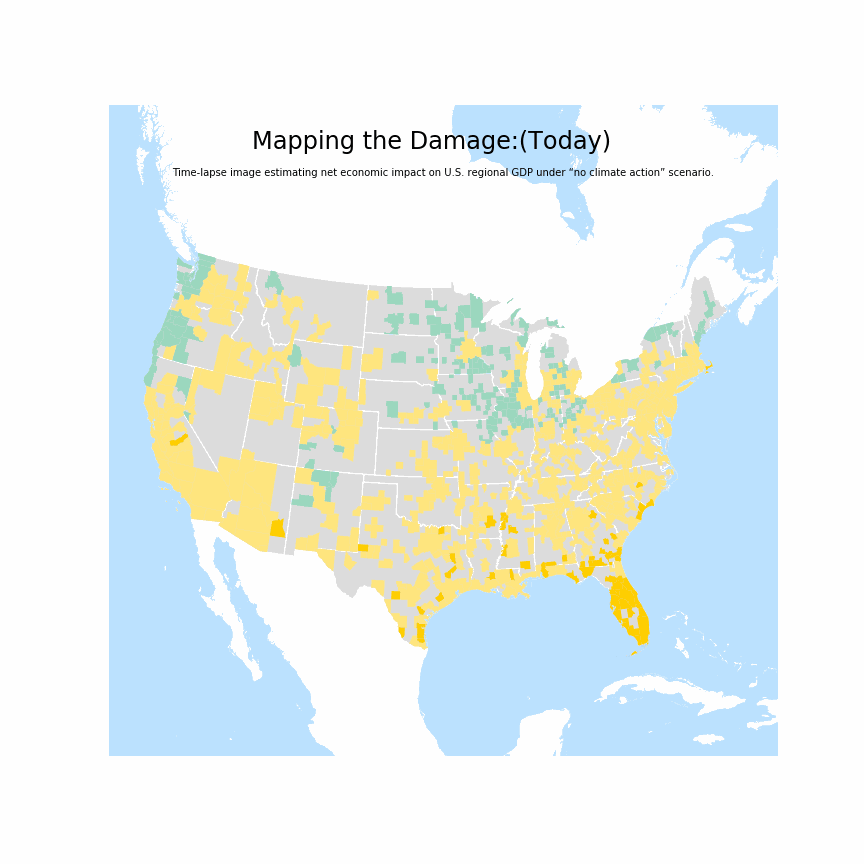
The biggest likely losers: the Gulf Coast region, the South Atlantic seaboard and much of Arizona. See the orange tones in the map. Florida tops the danger zones, with Naples, Panama City and Key West seeing likely annual GDP losses of up to 15% or more, mostly driven by coastal storms. Note these are average annual estimates; losses would likely come in big weather-driven shocks that could be much larger for a given year. The losses are not baked in: Decisive action could mitigate them. Yet the vulnerabilities revealed in this analysis have important implications for municipal bond issuers and investors. Our analysis shows climate-related risks pose a threat to the economies–and creditworthiness–of many U.S. state and local issuers in the $3.8 trillion U.S. municipal bond market.
Chart 2: A growing burden
Based on our work translating physical climate risks into implications for local GDP, we find a rising share of muni bond issuance over time will likely come from regions facing economic losses from rising average temperatures and related events. Within a decade, more than 15% of the current S&P National Municipal Bond Index by market value could come from U.S. metropolitan statistical areas suffering likely average annualized economic losses from climate change of up to 0.5% to 1% of GDP. And the impacts are projected to grow more severe in the decades ahead. This is illustrated in the A growing burden chart below.

Chart 3: Stormy weather
The Stormy weather chart below shows how the economic impacts of a warming climate could lead to rising U.S. CMBS loan loss rates over time. We illustrate the increasing risk to the U.S. CMBS market by overlaying Rhodium’s hurricane modeling onto the roughly 60,000 underlying commercial properties in BlackRock’s CMBS database. Our findings: The median risk of one of these properties being hit by a Category 4 or 5 hurricane has risen by 137% since 1980. Within three decades, the chance of being hit by a Category 5 hurricane is estimated to rise 275% under a “no climate action” scenario. See the chart below.
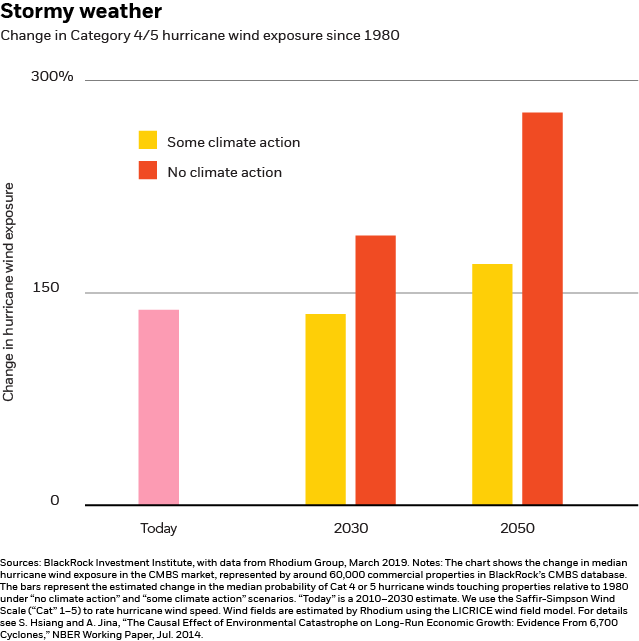
Chart 4: How exposed is my power plant?
Aging infrastructure leaves the U.S. electric utility sector vulnerable to climate shocks such as hurricanes and wildfires. We assess the exposure to climate risk of 269 publicly listed U.S. utilities based on the physical location of their plants, property and equipment. Our climate risk exposure scores by power plant combine the exposure to extreme weather at each power plant location with an assessment of the materiality of that exposure, based on historical losses and forward-looking climate modeling. See the How exposed is my power plant? chart below for a geographic representation of our climate risk scores by power plant. We then aggregate the average physical risk across all power plants to arrive at a total climate risk score for each utility.
A key finding from our analysis: Extreme weather events are not priced into the equities of U.S. electrical utilities. We find those with exposure to extreme weather events typically suffer temporary price and volatility shocks in the wake of natural disasters. We also find some evidence that the most climate-resilient utilities trade at a premium. We believe this premium could increase over time as the risks compound and investors pay greater attention to the dangers.

The work featured above and in our new paper is just a first step, focusing on three sectors with long-dated assets that can be located with precision. We plan to extend the research to other global regions, asset classes and sectors over time as data availability improves. Yet our early work already strengthens our conviction that sustainable investing is increasingly a “why not?” proposition.
Brian Deese is Global Head of Sustainable Investing at BlackRock and a contributor to The Blog.
Investing involves risks, including possible loss of principal.
Fixed income risks include interest-rate and credit risk. Typically, when interest rates rise, there is a corresponding decline in bond values. Credit risk refers to the possibility that the bond issuer will not be able to make principal and interest payments. Non-investment-grade debt securities (high-yield/junk bonds) may be subject to greater market fluctuations, risk of default or loss of income and principal than higher-rated securities.
International investing involves special risks including, but not limited to currency fluctuations, illiquidity and volatility. These risks may be heightened for investments in emerging markets.
This material is not intended to be relied upon as a forecast, research or investment advice, and is not a recommendation, offer or solicitation to buy or sell any securities or to adopt any investment strategy. The opinions expressed are as of April 2019 and may change as subsequent conditions vary. The information and opinions contained in this post are derived from proprietary and nonproprietary sources deemed by BlackRock to be reliable, are not necessarily all-inclusive and are not guaranteed as to accuracy. As such, no warranty of accuracy or reliability is given and no responsibility arising in any other way for errors and omissions (including responsibility to any person by reason of negligence) is accepted by BlackRock, its officers, employees or agents. This post may contain “forward-looking” information that is not purely historical in nature. Such information may include, among other things, projections and forecasts. There is no guarantee that any forecasts made will come to pass. Reliance upon information in this post is at the sole discretion of the reader. Past performance is no guarantee of future results. Index performance is shown for illustrative purposes only. You cannot invest directly in an index.
©2019 BlackRock, Inc. All rights reserved. BLACKROCK is a registered trademark of BlackRock, Inc., or its subsidiaries in the United States and elsewhere. All other marks are the property of their respective owners.
BIIM0419U-831608-1/1