by Liz Ann Sonders, Senior Vice President, Chief Investment Strategist, Charles Schwab & Co
Key Points
- Inflation has been low for a generation of investors, with recency bias helping keep expectations subdued.
- Some shorter-term forces could change the inflation outlook, including fiscal stimulus, tight labor conditions and tariffs/trade policies.
- But there are also longer-term forces which are changing, including most importantly globalization.
“The trend is your friend.”
An oft-used phrase—coined by the late-great Marty Zweig, with whom I worked for my first 13 years in this business (1986-1999)—was generally tied to the notion that directional stock market momentum should not be ignored. Momentum for any number of factors can be a friend; but also a foe if it unexpectedly turns in the opposite direction.
Marty taught me a lot about contrarian analysis and thought; although he would have been the first to admonish anyone who was a contrarian just for the sake of being one. However, he ingrained in me a thought process that sticks with me today. It’s best described by an oft-expressed mantra of mine: Be at least as intrigued by the story no one is telling than by the story everyone is telling.
The story no one is telling?
This brings me to today’s topic: inflation. I often gauge investor interest in a topic by the Q&A sessions following investor events at which I speak every week. In the two-to-three year period following the Federal Reserve’s global financial crisis (GFC) foray into zero interest rate policy (ZIRP) and start to three rounds of quantitative easing (QE), the topic of inflation abounded. Easily, at least half of the questions I’d get were about a perceived “inflation accident waiting to happen” courtesy of the Fed having opened its money “printing press.” I’ll get to why we were not in the inflation camp then in a bit.
But perhaps it’s time to at least wonder whether inflation’s demise was really more of a long slumber, from which it’s about to stir? I can’t remember the last time I got a single question about inflation risk from an investor (other than sidebar conversations about whether the traditional government-produced measures accurately reflect the kind of inflation we generally experience every day).
I am by no means in the runaway inflation camp; in keeping with myriad secular forces likely to remain constraints on inflation longer-term. But the rub is that some of these secular forces could be adjusting because of today’s unique environment—particularly protectionism, nationalism and trade war(s)—while traditional inflation-triggers like a tight labor market are increasingly evident.
Recency bias
I sit on Schwab’s Asset Allocation Working Group and during our most recent bi-weekly meeting we discussed inflation and the concept of recency bias—also thought of as an “adaptive expectations framework.” My colleague Kathy Jones, Schwab’s chief fixed income strategist, recently wrote about the topic as well in an internal report. In it, she referenced a study by the New York Fed highlighting that once inflation expectations are formed, they are resistant to change. Consequently, while older people are fearful of inflation, there is now a whole generation with no experience of inflation, and is relatively complacent about it: “They find that inflation expectations are heavily influenced by the inflation experience in one’s own lifetime, which implies that decades of too low inflation can become embedded in expectations.”
https://www.newyorkfed.org/newsevents/speeches/2019/wil190222
Inflation is not widely on radar screens because of its conspicuous absence in recent years. U.S. headline inflation rolled over last year due to the collapse in oil prices, with inflation break-evens having plunged to below the 2.3-2.5% range that is consistent with the Fed’s 2% inflation target. The Fed’s preferred measure—core personal consumption expenditures (PCE)—has been at or above the 2% target only six months out of the past seven years. However, there are some other Fed-based measures that are above target; while they are generally trending higher.
Inflation Remains Low
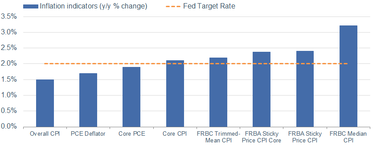
Source: Charles Schwab, Bloomberg, Bureau of Labor Statistics, Federal Reserve. CPI as of January 31, 2019. PCE as of December 31, 2018.
There is another, newer, inflation measure recently created by the New York Fed. They named it the Underlying Inflation Gauge (UIG); which is a broader measure than most others and “captures sustained movements in inflation from information contained in a broad set of price, real activity and financial data.” As you can see in the chart below, it has tended to lead the other traditional inflation measures by about 16 months and portends upward trends for both core PCE and the consumer price index (CPI).
Is UIG Presaging Higher Core Inflation?
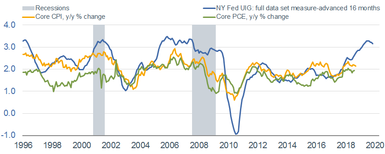
Source: Charles Schwab, FactSet, Federal Reserve Bank of New York Underlying Inflation Gauge (https://www.newyorkfed.org/research/policy/underlying-inflation-gauge), Ned Davis Research (NDR), Inc. (Further distribution prohibited without prior permission. Copyright 2019 (c) Ned Davis Research, Inc. All rights reserved.). CPI and UIG as of January 31, 2019. PCE as of December 31, 2018.
Inflation expectations remain low as well, with only the University of Michigan’s measures above the Fed’s 2% target. But in the case of the 10-year breakeven rate (currently at about 1.9%), it’s up from 1.68% at the start of this year—having retraced nearly half its decline from last October’s 2.17%.
Inflation Expectations Remain Low
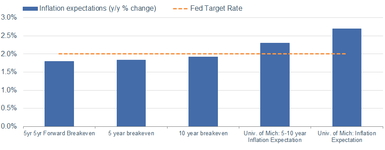
Source: Charles Schwab, Bloomberg, University of Michigan, as of March 8, 2019.
But what’s changed short-term?
There are some shorter-term phenomena which could put some upward pressure on inflation, including last year’s significant fiscal stimulus—notably tax cuts—into an economy that was late in its cycle and already operating above potential. Add to that, the extreme tightness in the labor market. The unemployment rate (UR) has been below the so-called “natural rate” for nearly two years. In addition, for the first time in the history of the monthly data from the Job Openings and Labor Turnover Survey (JOLTS), there are more job openings than there are unemployed people to fill them.
Job Openings > Unemployed People
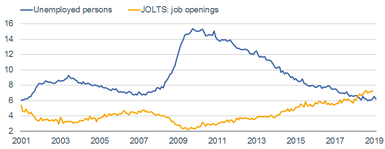
Source: Charles Schwab, Department of Labor, FactSet. Unemployed persons as of February 28, 2019. JOLTS as of December 31, 2018.
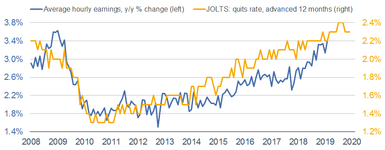
A component of the JOLTS survey is the “quits rate,” which is the percentage of employed quitting their jobs voluntarily—ostensibly due to confidence in finding another job. That trend dovetails nicely with average hourly earnings (AHE), the standard-bearer for wages (with a lag). As you can see below, advancing the quits rate by a year suggests wage pressures should continue to rise from their recent cycle high of 3.4% year-over-year.
Quits Rate Presaging Even Higher Wages?
Source: Charles Schwab, Department of Labor, FactSet. Unemployed persons as of February 28, 2019. JOLTS as of December 31, 2018.
Another factor clouding the inflation picture is the trade war and tariffs. Two recent papers have been getting attention in both academic and economists’ circles—and were brought to my attention by John Mauldin via his associate Patrick Watson. The first came from the Center for Economic Policy Research (CEPR) and the second from UCLA, the National Bureau of Economic Research (NBER), Yale, UC Berkeley, Columbia GSB and the World Bank.
www.princeton.edu/~reddings/papers/CEPR-DP13564.pdf
www.econ.ucla.edu/pfajgelbaum/RTP.pdf
Key points from the CEPR study:
- Tariffs the Trump administration imposed in 2018 costs U.S. companies and consumers approximately $3 billion per month in additional “taxes.”
- U.S. businesses spent another $1.4 billion per month in “deadweight losses” due to tariff-driven delays and supply chain interruptions.
- The U.S. companies and consumers paid almost all these costs. Foreign exporters sold their goods to other buyers without cutting prices.
- Prices on imported goods rose about 1% on average, roughly equivalent to raising the average annual inflation rate by half on those products.
- Tariff revenue the U.S. collects does not compensate consumers who must pay higher prices.
As Patrick concluded: “Even if you assume that trade policies will ultimately help the U.S. economy, the benefits and costs aren’t evenly distributed. Some businesses and regions win and others lose. Like real war, trade war has casualties even when your side ultimately wins.”
What’s changing longer-term?
Tied to the trade war is globalization and its likely apex. Globalization has been an essential ingredient in the disinflationary recipe of the past couple of decades. The launching of a trade war may be exacerbating globalization’s retreat, but it was in partial view even before the 2016 presidential election and arguably dates back to the GFC. As highlighted by BCA Research, the Reagan-Thatcher-Koizumi policies that were ascendant after the fall of the Berlin Wall—boosting global growth while tamping down inflation—have been in retreat in the developed world ever since the crisis.
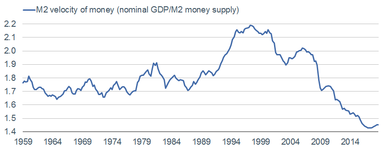
Another factor to consider (albeit fledgling at this point) is the turn up in the velocity of money—measured by the ratio of nominal gross domestic product (GDP) to M2 money supply and as seen in the chart below. In simple terms velocity measure the rate at which money is exchanged in an economy (the number of times money is moving from one transaction to another). As noted at the beginning of this report, we were decidedly not in the inflation camp coming out of the GFC, regardless of the Fed’s moves to ZIRP and QE. This was because of the rapid decline in money velocity—it’s simply near-impossible to develop a serious inflation problem with so little money velocity.
Money Velocity Turning Higher?
Source: Charles Schwab, Bloomberg, as of December 31, 2018.
Tight labor market + rising money velocity = ?
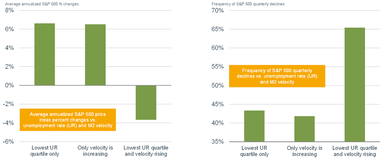
Most investors broadly know that rising inflation isn’t the stock market’s BFF—especially given that earnings are generally less valuable when inflation is rising. My friend Jim Paulsen at The Leuthold Group recently looked at the relationship between a tight labor market, money velocity and stock market behavior. As you’ll see in the charts below, when you combine low levels of unemployment with rising money velocity you have historically had the recipe for weaker stock market returns alongside greater frequency of declines. Food for thought for equity investors.
Velocity/UR Impact on Stocks
Source: Charles Schwab, The Leuthold Group. 1959-December 31, 2018.
Another longer-term change is the credibility of the Fed, as Kathy noted in her recent report. Central banks in developed economies are aggressively trying to pull themselves out of their deflationary spirals; while some—even possibly including the Fed down the road—are considering raising their inflation targets to signal higher inflation tolerance. Add to that the aforementioned expansionary fiscal stimulus and its attendant rising deficits/debt, and we may have to consider that inflation’s trend may cease to be investors’ friend.
Concluding with a positive offset
Because we’ve been more cautious about the economy and markets over the past year, I always try to keep from being negatively one-sided. So I’ll conclude with why there is hope that even if inflation ticks higher near-term, there remains one hopeful force which could keep it generally tame: productivity. From a low of -0.3% year-over-year change in non-farm labor productivity in 2016’s second quarter, it has jumped to +1.8% as of the fourth quarter of 2018. Higher productivity allows the tight labor market to spur changes in the allocation of resources such that more goods and services are available without a so-called “wage-price spiral” occurring. Of course, if the productivity revival loses steam, inflation could pick up steam; but for now, productivity’s trend is inflation’s friend.
Copyright © Charles Schwab & Co

