by Jeffrey Saut, Chief Investment Strategist, Raymond James
I was traveling last week seeing portfolio managers and doing gigs for our financial advisors and their clients. I have been doing such events for much of the past six months. The recurring question from clients is, “What about the national debt?” First, I would point out that when everyone is asking the same question it is usually the wrong question.
Yet, last week that question hit its zenith as the media trumpeted that the national debt had traversed $22 trillion dollars. With that, I kept getting the same recurring question at events: “Jeff, the debt to GDP is above 100%. Doesn’t that worry you?” My answer has always been:
I don’t think the debt-to-GDP ratio is the right lens to view the debt issue. In a past life I was a fundamental analyst writing stock-specific research on individual companies. When we researched a company we always looked at assets to liabilities. NOBODY looks at America in that way.
I don’t know what the Grand Canyon is worth, but it is worth a lot. I don’t know what the Tetons are worth, but they a worth a lot. Now obviously we are not going to sell the Grand Canyon, but the government has many levers to “pull.” A couple of months ago I was driving from San Antonio to the Hill Country to speak at an event.
Along the way I drove by an army depot, with nobody there, that had to be 15 miles long. It brought to mind the fact that the government is selling such properties for big bucks. Indeed, the government has many levers it can pull.
Also speaking to this point, our friend, Riverfront Investment Group’s Doug Sandler, in an article titled “National Debt . . . No Time to Worry Yet,” writes this:
In theory, investors should have one less thing to worry about with the passage of the federal spending bill last week, which averted a second government shutdown. However, true to form, investors replaced the fear of too little government spending with new concerns about too much government spending.
Given that the bill’s passage coincides with the federal debt surpassing $22 trillion and now exceeding our country’s gross domestic product (GDP), the concern seems justified. In fact, The National Debt Clock personalizes the $22 trillion figure by reminding us that it equates to about $67,000 per US citizen, or roughly $180,000 per US taxpayer.
As scary as the federal debt appears, we are less concerned for two reasons. First, in our opinion, several mitigating factors make the debt load less precarious than what is reported in the headlines. Second, the ‘warning lights’ that would typically flash before a debt crisis remain unlit.
According to the Congressional Budget Office’s (CBO) January 2019 report, roughly $5.5 trillion of the $22 trillion is intergovernmental debt. Intergovernmental debt is the debt that the government owes to itself. For this reason, many economists believe that ‘Federal Debt Held by the Public’, which excludes intergovernmental debt, is the more important measure of the Federal government’s indebtedness.
By this measure, the federal debt is expected to grow to $16.6 trillion by year-end. While $16.6 trillion is a big number, it’s 25% smaller than $22 trillion and well below the psychological threshold of exceeding 100% of GDP.
Although it would be highly unlikely, if the U.S. was obligated to put up collateral for its loans, there are plenty of assets it could pledge. A few of the ‘priceless’ assets it controls include prime land (national parks) and buildings, a portfolio of patents, usage rights to digital access, and spectrum and mining rights for energy and minerals.
Lastly and most importantly, the Federal government has the ability to print its own currency, like it did in the years following the Financial Crisis. Since 2008, the Federal government printed over $2 trillion in US dollars and has the ability to print even more. In theory, no country with its debts denominated in its own currency should fail to make good on its debt obligations.
Doug’s conclusion is that warning lights are not flashing. Obviously I agree with Doug, having used the same points as Doug’s 2 and 3. I must admit, however, I have never heard about the intergovernmental debt discussed in point 1, but it is a pretty important point. So, I hope this missive allays concerns about the debt-to-GDP question that I keep getting asked.
Turning to the equity markets, last week the D-J Industrial Average (INDU/26031.81) notched its eighth consecutive weekly gain for the longest weekly upside skein since May 1995. According to our friends at Bespoke:
"Despite lots of economic data weakness both in the US and around the world, earnings have been coming in at a respectably strong pace in the US, and asset markets from Asia to Latin America have been rallying steadily.
Whether the explanation is still-cheap valuations, less hawkish central banks, the hopes of positive effects from credit stimulus in China, or possible winding down of trade tensions, there’s plenty of explanations for the ongoing equity rally."
Meanwhile, the Advance-Decline Line for the S&P 500 continues to trade to new all-time highs and as Leon Tuey points out, “The A/D Line is a much better indicator of the strength of the equity markets than any index.” Other breadth metrics are equally as strong. The eight-week rally has caused AAII’s bullish sentiment to rise to 39.32%, which is not all that extreme. However, bearish sentiment has fallen to 25.39%, which is somewhat extreme.
The strong rally continues to leave all of the overbought indicators I follow at extreme overbought levels, as well credit spreads are somewhat elevated vis-a-vis credit, which could be a red flag for stocks in the short term (chart 1 below). Interestingly, given all the recession talk, Dr. Copper, one of the best economic indicators, has broken out to the upside in the charts (chart 2 on page 3). And don’t look now, but crude oil has broken out in the charts to the upside (chart 3); buy the midstream MLPs.
The call for this week: Over the weekend Jim Paulsen said, “Last year to be successful you had to find a way to stay appropriately cautious in the face of nothing but optimism. This year you must stay bullish in the face of nothing but pessimism on fears of slowing earnings growth, trade wars, and other threats.”
Speaking to earnings, so far of companies reporting 4Q18 earnings 63.8% have beaten the estimates, while 60.1% have bettered revenue estimates. That is not as strong as the past four quarters, but it still is not bad. My indicators that were looking for an energy polarity peak have reversed with the mild stall we have seen and currently are configured again to the upside.
I did not expect that, but in this business you take what they give you. As one of my mentors used to say, “It is no disgrace to guess wrong, the mistake is to stay wrong!” My indicators now reflect an upside move without much of a pullback. The pace of the rally should slow, however, following this extraordinary December upside run
This morning the preopening S&P 500 futures are better by some 13 points as I write at 5:17 a.m. because the president has delayed the implementation of further tariffs of Chinese goods.
Chart 1
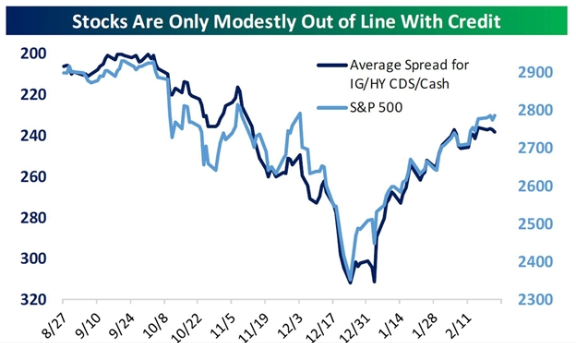
Source: Bespoke Investment Group
Chart 2
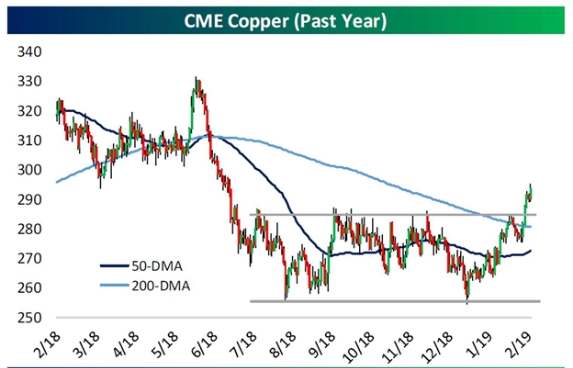
Source: Bespoke Investment Group
Chart 3
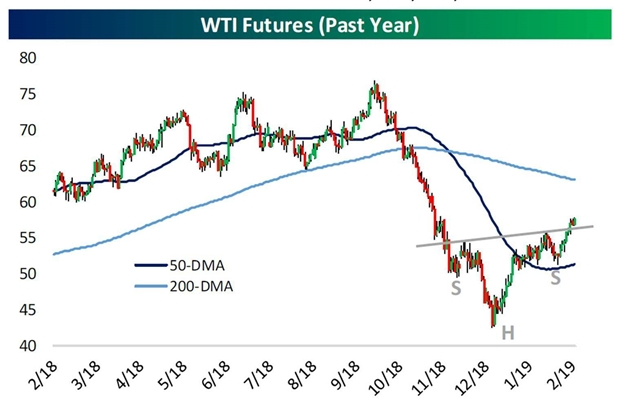
Source: Bespoke Investment Group
Additional information is available on request. This document may not be reprinted without permission.
Raymond James & Associates may make a market in stocks mentioned in this report and may have managed/co-managed a public/follow-on offering of these shares or otherwise provided investment banking services to companies mentioned in this report in the past three years.
RJ&A or its officers, employees, or affiliates may 1) currently own shares, options, rights or warrants and/or 2) execute transactions in the securities mentioned in this report that may or may not be consistent with this report’s conclusions.
The opinions offered by Mr. Saut should be considered a part of your overall decision-making process. For more information about this report – to discuss how this outlook may affect your personal situation and/or to learn how this insight may be incorporated into your investment strategy – please contact your Raymond James Financial Advisor.
All expressions of opinion reflect the judgment of the Equity Research Department of Raymond James & Associates at this time and are subject to change. Information has been obtained from sources considered reliable, but we do not guarantee that the material presented is accurate or that it provides a complete description of the securities, markets or developments mentioned. Other Raymond James departments may have information that is not available to the Equity Research Department about companies mentioned. We may, from time to time, have a position in the securities mentioned and may execute transactions that may not be consistent with this presentation’s conclusions. We may perform investment banking or other services for, or solicit investment banking business from, any company mentioned. Investments mentioned are subject to availability and market conditions. All yields represent past performance and may not be indicative of future results. Raymond James & Associates, Raymond James Financial Services and Raymond James Ltd. are wholly-owned subsidiaries of Raymond James Financial.
International securities involve additional risks such as currency fluctuations, differing financial accounting standards, and possible political and economic instability. These risks are greater in emerging markets.
Investors should consider the investment objectives, risks, and charges and expenses of mutual funds carefully before investing. The prospectus contains this and other information about mutual funds. The prospectus is available from your financial advisor and should be read carefully before investing.
Copyright © Raymond James