
by Blaine Rollins, CFA, 361 Capital
This is a big week for geopolitics. While the media is focused on the meetings with North Korea in Vietnam, the markets remain focused on the trade negotiations with China. The White House is inching closer to a U.S./China trade deal which is being confirmed by the strength in the Chinese currency and stock markets.
In fact, the Chinese stock market is now outperforming the U.S. industrial stocks. Copper metal is also surging higher implying that Chinese manufacturing could accelerate once trade begins again.
Back in the U.S., a slew of economic data last week (both live and delayed) showed that the U.S. economy continues to slow down. But the release of the Fed minutes showed concerns over future weakening data which helps to explain why they moved quickly away from a tightening bias.
So further confirmation that they will let the numbers run hot for a while and worry less about inflation in the event that the data picks up again under any sort of global trade resolution. Bottom line, the punch bowl is back on the table and Powell is freshening up the punch for the markets.
As for risk positioning, I would look into [highlight] those areas of the market which are performing best as we near a trade resolution [/highlight] . So Emerging Market equities and bonds, U.S. Industrial stocks, Industrial Metals, which could benefit from an uptick in global manufacturing, and Gold which could benefit from a Fed ignoring inflation.
Select Technology stocks which have heavy exposures to China may also see a tailwind once a deal gets signed. Tough times for stock pickers right now with global macro events trumping individual company execution.
To receive this weekly briefing directly to your inbox, subscribe now.
That was an ugly Philadelphia Fed survey last week…
This is a big and important number. If a trade deal with China gets struck, it will be interesting to see what kind of bounce we can get out of it.

But while the Philly Fed was the biggest negative last week, this chart shows that many other economic data series are surprising to the downside…

(@SoberLook)
But not all is bad, here is some leading-indicator notable strength…

So where are the best year-to-date returns for U.S. investors?

As the S&P 500 moves back to crossing above its 200-day moving average, now is a good time to revisit the importance of this major trend indicator…
The chart below shows the S&P 500 with the 200-day SMA in red. The index crossed this key moving average some 180 times from January 1994 to January 2019. That averages out to around 7 crosses per year. There were 90 completed bullish signals during this time period. This involves buying when the S&P 500 crosses above the 200-day and selling when the index crossed below the 200-day SMA. Of these signals, there were 20 winners with an average gain of 13.69% and 70 losers with an average loss of 1.32%. The winners outpaced the losers overall, but there were a lot of whipsaws.

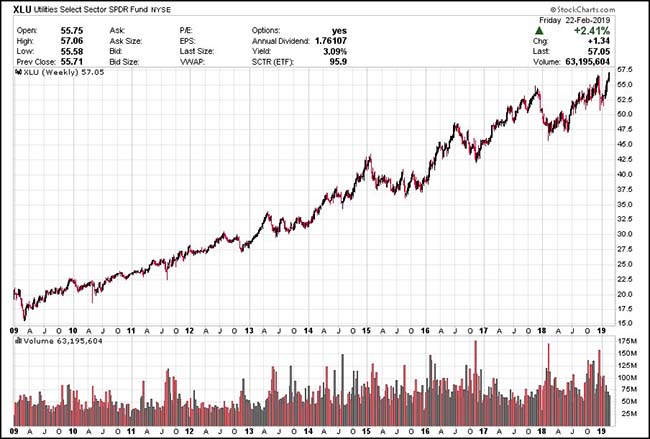
For many, Utility stocks aren’t even on the radar. Big mistake…
@JackDamn: I mean, who doesn’t love Utilities? Fat dividends, low volatility, and a gorgeous trend (sans $PCG). $XLU
So much for my December panic over leveraged loans…
@charliebilello: Leveraged Loans joined the party today as well, fully recovered from Oct-Dec correction, new all-time highs. $BKLN

Big bond investors are less than happy with the newest Fed positioning…

To receive this weekly briefing directly to your inbox, subscribe now.
Not just a beautiful country, if you are looking for a hot Emerging Market, Vietnam is on fire…

(WSJ)
Mad men, Wall Street and ground floor retail continue to be in decline for Manhattan which can’t be helping their residential real estate prices…
@carlquintanilla: Manhattan home prices, via Deutsche. “Currently falling at a rate of 4% year-over-year.”

If you want to know why Americans are now living shorter lives, 190 deaths per day from opioids is now the single biggest reason…
Drugs now kill about 70,000 Americans every year—more than car crashes or guns (both 39,000), more than aids did at the height of its epidemic (42,000), and more than all the American soldiers killed in the entire Vietnam war (58,000). In 2017 about 47,600 of those deaths were caused by opioid overdose—a fivefold increase since 2000. Only 32% of those opioid deaths involved prescription pills; the rest were from illegal heroin and fentanyl (see chart 1). But three out of four heroin users first became addicted to pills.
Chart the overdose death rate in America since 1980 and a terrifying graph emerges (see chart 2)—an exponential curve increasing at a constant clip of 7.6% per year. Estimates suggest that the epidemic will rage for at least a further five to ten years, killing more than 50,000 people each year. An urgent and sensible response would be able to bend this death curve somewhat, to reduce the harm yet to come. But the response has been slow and fitful at best, even though measures that would help are well-known. What started as a problem of abused prescription drugs has been transformed by corporate greed, a failure of the health system and a lack of political will into a social disaster.

Sociopath of the week?
Yet through all of this, former employees of the company have told me, Holmes had a bizarre way of acting like nothing was wrong. Even more peculiarly, she appeared happy. “The company is falling apart, there are countless indictments piling up, employees are leaving in droves, and Elizabeth is just weirdly chipper,” a former senior executive told me. One former board member also noted that Holmes would come to board meetings “chirpy” and acting as if everything was “great.” She would walk up to people in the office who could have just testified in front of the S.E.C., or been questioned by lawyers at the F.D.A., and she would give them a hug and ask how they were doing. She was so confident that the company would be fine, executives who worked with her said, that she enrolled Balto in a search-and-rescue program. Holmes spent weekends training him to find people in an emergency. Unfortunately, huskies are not bred for rescue; they are long-distance runners, and Balto failed out.
One would have to be a sociopath to want to take the Eurostar after Brexit…
Queues for Eurostar train services at London’s St Pancras International could reach up to 15,000 passengers each day in the event of a no-deal Brexit, according to a confidential report drawn up by the British government.
The Department for Transport analysis, seen by the Financial Times, says a daily queue of that length could develop if Britain crashes out of the EU and France subjects UK and non-EU passengers at St Pancras to rigorous passport checks.
According to one government insider familiar with the DfT report and its worst-case scenario, a queue of 15,000 people would stretch for almost one mile along the Euston Road, from St Pancras to Warren Street underground station.
“Something like that could never be allowed to happen,” said this person. “Eurostar and the UK authorities would have to cancel trains and pre-notify passengers to prevent them turning up. A 40-60 per cent reduction in Eurostar services would be the only conceivable response.”

(@seatsixtyone)
Copyright © 361 Capital