
Two of the biggest lessons for investors so far in 2018 have been that its dangerous to be complacent and risks may go dormant for a while, but they rarely completely disappear. A third lesson emerging this week is the old saying that history doesn’t repeat, it rhymes.
The first half of this decade saw the European Union mired in a financial crisis as countries dealt with high debt loads, particularly Greece, Ireland, and Portugal. While small countries near the edges of the Eurozone bore the brunt of the financial crisis, there was always a lingering fear that the small countries were being made examples of to keep bigger countries in line.
In recent years, fears of a Eurozone breakup had subsided but roared back this week with a vengeance. To add to the risk, what was previously seen as primarily a financial crisis, has morphed into a political crisis as well.
This week, both Italy and Spain took steps toward holding new elections that could be setting up as battles between the Pro-EU establishment and populist/separatist/Euroskepic forces. Of the two, Italy’s political turmoil had a more wide-ranging impact on markets. Earlier this week, a coalition of two populist parties saw their Euroskeptic choice for Finance Minister rejected, kicking off a political crisis. Italy’s treasury yield jumped on the news, a big deal because Italy is the world’s third largest sovereign borrower.
Concerns that the EU could find itself dealing with a new, larger crisis in core countries sent investors fleeing risky markets and fleeing for defensive havens. Stock markets sold off, particularly in Europe and commodities fell back while the US Dollar, Gold, Bonds, and the Japanese Yen rallied. Capital moving back into stocks pushed down US treasury yields even though more interest rate hikes from the Fed are expected.
There have been lots of other political developments in the headlines lately which have had no major or lasting impact on markets, like the US-North Korea soap opera, or seen their impact contained to some markets, like the potential for sanctions against Iran and Venezuela on the oil price and energy stocks. The sudden shock to the system from Italy had a wider impact because it comes out of a financial crisis and could have a bigger impact on the global financial system. Even if the initial rush to reallocate subsides, it could take months to fully clear the air and so the lingering impact of these developments could impact sentiment through the summer and beyond.
In this week’s issue of Equity Leaders Weekly, we look at what increased political risks and financial strains in Europe has meant for the Euro relative to the US Dollar and for US treasury yields.
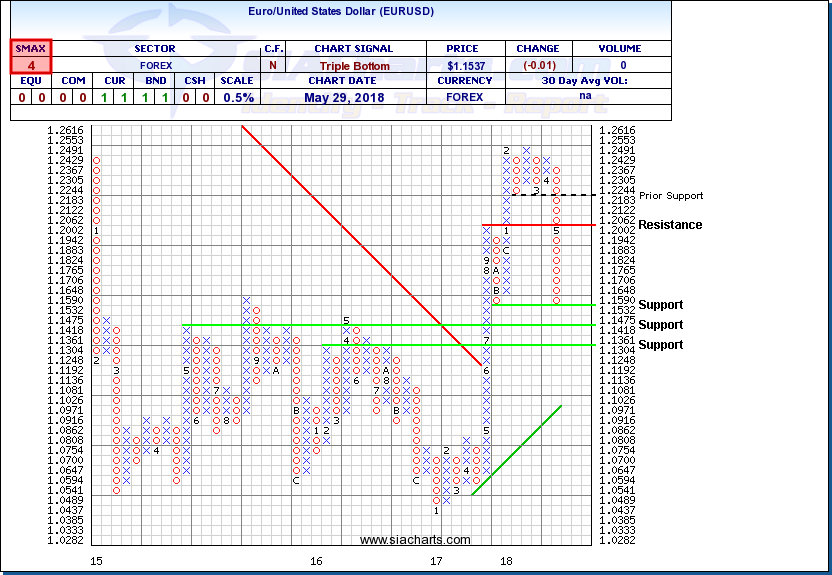
Euro/United States Dollar (EURUSD)
When we last looked at EURUSD in the March 1st issue of Equity Leaders Weekly, a big advance in the pair had stalled short of $1.2500 resistance and had moved into a $1.2183 to $1.2553 trading range with risks to the downside. This range persisted for a while before the bottom fell out from under it. Once $1.2183 was breached, downward pressure increased, and the pair tumbled dramatically, taking out the $1.2000 round number then $1.1883 on its way toward $1.1532. Meanwhile, its SMAX score has dropped from 6 to 4, a sign of weakening short-term performance relative to the asset classes.
Next potential downside support for EURUSD appears near $1.1418 and $1.1304 should the weakness continue. It would take a move up through $1.1765 to complete a 3-box reversal to the upside.
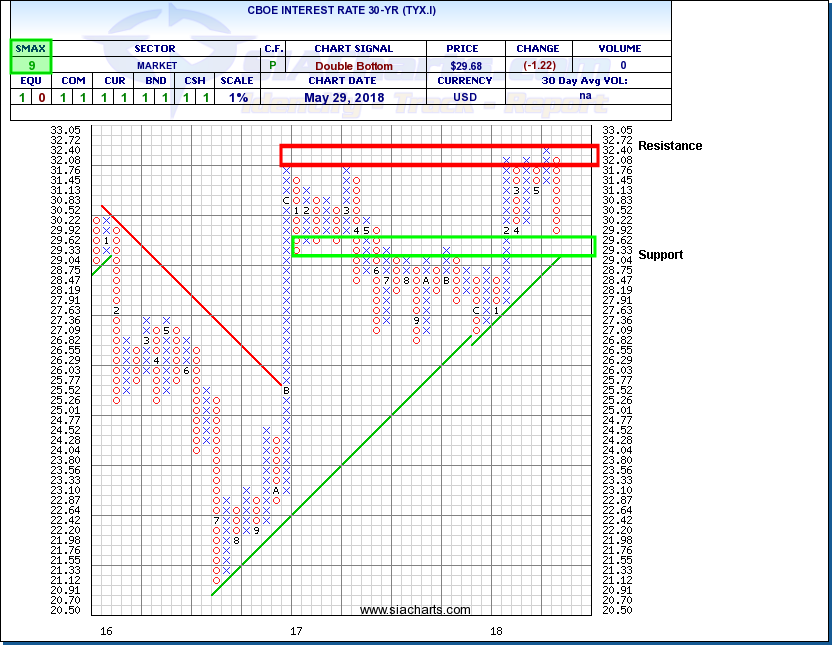
CBOE Interest Rate 30-Year (TYX.I)
The 30-year US treasury interest rate (TYX.I) has undergone a big reversal in recent weeks, peeking up toward 3.272% earlier in May then plunging back down toward 3.00% briefly dipping under that key level, where it currently stands today.
There are two aspects that are particularly striking about this move.
First, its amazing that only a few short months ago, the 30-year rate moving up above 3.00% sparked a big selloff in US stocks. On the other hand, US indices have hardly budged with interest rates falling back below 3.00%. This might indicate that even though the interest rate breakout was the trigger for the February market meltdown, the main underlying cause was a year-plus of straight gains. Between November 2016 and January 2018, indices were overextended, exhausted, and overdue for a correction. The lack of a rebound in US stocks indicates that investors recognize that the decline in yields is due to external forces which may only have a temporary impact. The Fed’s interest rate outlook and the fundamental outlook for US corporate earnings haven’t changed.
Second, this action really highlights the inverse relationship between bond prices and interest rates. Back in February, rising interest rate expectations drove the treasury yield up and US bond prices down. This time around, bond prices are the driving force with investors dumping their Italian bonds and plowing their cash into assets traditionally perceived as safer havens including US and Japanese bonds plus gold. This shift has also sparked demand for the US Dollar, as we saw in the above EURUSD comparison, and Japanese Yen.
Friday brings the last non-farm payrolls report before the mid-June FOMC meeting where a US interest rate increase is widely expected. Unless something else flares up in Europe or elsewhere overseas, we could see the focus in TYX.I shift back to domestic concerns in the coming days.
SIACharts.com specifically represents that it does not give investment advice or advocate the purchase or sale of any security or investment. None of the information contained in this website or document constitutes an offer to sell or the solicitation of an offer to buy any security or other investment or an offer to provide investment services of any kind. Neither SIACharts.com (FundCharts Inc.) nor its third party content providers shall be liable for any errors, inaccuracies or delays in content, or for any actions taken in reliance thereon.
For a more in-depth analysis on the relative strength of the equity markets, bonds, commodities, currencies, etc. or for more information on SIACharts.com, you can contact our sales and customer support at 1-877-668-1332 or at siateam@siacharts.com.
Copyright © SIACharts