


by Liz Ann Sonders, SVP, Chief Investment Strategist, Charles Schwab and Company
Key Points
- S&P earnings are up more than 25% for the first quarter and estimates are for more than 21% for the full year.
- Following a record-setting “beat rate” of nearly 80%, is the best now behind us?
- The earnings bar is now set high, while valuations could be weighed down by higher inflation and interest rates.
With more than 85% of first quarter S&P 500 earnings having been reported, it’s time for a quick chart-filled update on what has been a stellar earnings season to-date. As you can see in the table below, across the spectrum—from the blended growth rate (already reported plus remaining estimates) to the percentage above estimates to the percentage surprise factor—the results have been exceptionally strong.
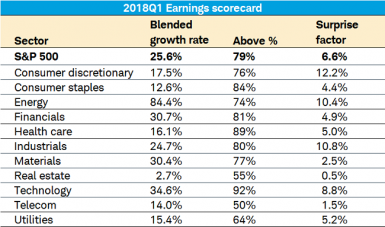
Source: Charles Schwab, Thomson Reuters I/B/E/S, as of May 4, 2018.
Beat it
The 79% “beat rate” for the overall S&P 500 index is an all-time record and credit can be given to tax reform—in particular the corporate tax cut to a 21% statutory rate. In November of 2017 the expectation for calendar year 2018 year-over-year growth for the S&P 500 was about 11%; while today, that’s grown to about 21%. In the table below you can see the expectations for both 2018 and 2019 growth for the index overall, as well as the 11 S&P sectors.
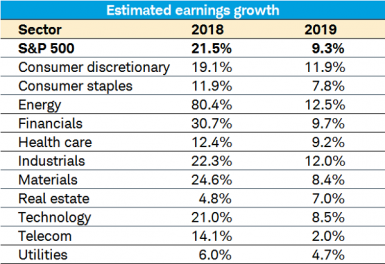
Source: Charles Schwab, Thomson Reuters I/B/E/S, as of May 4, 2018.
The improvement in earnings has not just been a tax reform story as some of the surge pre-dated the passage of the tax bill. In addition, the surge in energy prices from their 2015 lows has been a huge tailwind for the energy sector. As you can see in the chart below, after a four-quarter earnings recession, which spanned from the mid-point of 2015 to the mid-point of 2016, the acceleration led to three out of four quarters in 2017 showing double-digit growth. All four quarters are expected to see double-digit growth in 2018.
Impressive Earnings Rebound
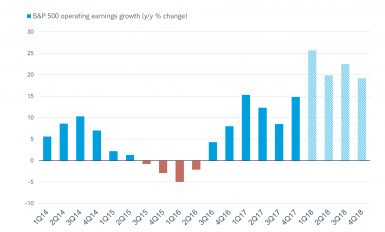
Source: Charles Schwab, Thomson Reuters I/B/E/S, as May 4, 2018. 1Q18-4Q18 based on estimated earnings growth.
Be careful what you wish for
Not to throw cold water on the story, but there’s a contrarian story to tell when earnings growth joins the > 20% club. In keeping with the “better or worse tends to matter more than good or bad” message I give to investors consistently, the stock market has a keen ability to sniff out inflection points in advance. Yes, 20%-plus earnings growth is good news in an absolute sense, but it also likely represents a rate fairly close to the ultimate peak growth rate—beyond which the growth rate will inevitably slow.
Investors should not be extrapolating the boost to earnings from tax (and regulatory) reform too far into the future; while questioning whether the boost is already reflected in stock prices.
As you can see in the table below, stocks have actually had fairly weak (albeit positive) returns historically when S&P earnings growth has exceeded 20%. Notice as well that the best zone for earnings growth has actually been when earnings are declining by double-digits (reflecting the market’s tendency to discount what’s going to happen, not just react to what’s already happened).
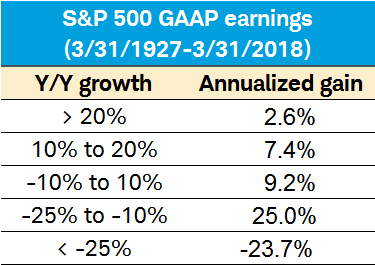
Source: Charles Schwab, Ned Davis Research (NDR), Inc. (Further distribution prohibited without prior permission. Copyright 2018 (c) Ned Davis Research, Inc. All rights reserved.).
Multiples down for multiple reasons
It’s not just earnings that matter, but valuations associated with those earnings. The multiple that investors are paying for stocks has been declining alongside higher inflation and interest rates (which also impact profit margins); but also because of the correction which began in late-January. In fact, the forward price/earnings (P/E) ratio declined more than the market during the correction; because as the P was dropping, the E was accelerating.
Stocks Corrected, P/Es “Crashed”
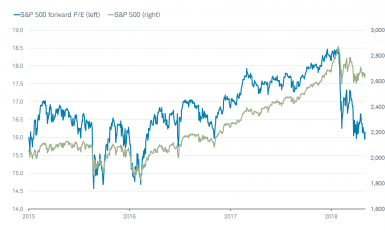
Source: Charles Schwab, FactSet, as of May 4, 2018. P/Es are based on forward 12-month consensus operating earnings.
As a result, the forward P/E has moved back down toward its long-term median, as you can see in the chart below.
Forward P/E Heads Toward Median
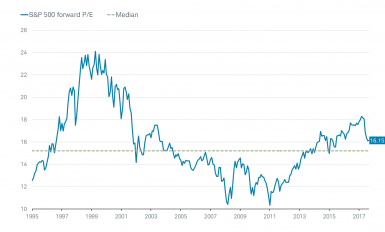
Source: Charles Schwab, FactSet, as of May 4, 2018. P/Es are based on forward 12-month consensus operating earnings.
But as I mentioned, higher inflation tends to put downward pressure on valuations. As you can see in the table below, we are currently in the “sweet spot” for valuations, with the consumer price index (CPI) at 2.1%. But as inflation moves higher, the forward P/E has historically moved lower. In simple terms, this is a function of earnings being less valuable when inflation is higher. When inflation rises it leads investors to require a higher rate of return to maintain their purchasing power, which causes the P/E to fall.
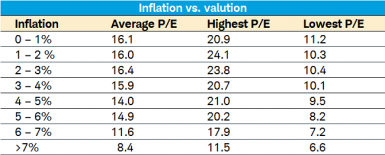
Source: Charles Schwab, Bureau of Labor Statistics, FactSet, 1958-March 31, 2018. Inflation is y/y % change based on core CPI.
In sum
Earnings growth has been exceptionally strong; but much of the latest acceleration is already in the books and partly a function of one-time factors. This does not necessarily signal the end of the bull market, but it does suggest the bar has been set quite high, which could lead to both disappointments and bouts of volatility as markets look out toward a slower growth rate and deteriorating profit margins.
Copyright © Charles Schwab and Company