
It has been another active week for trading in world markets. US indices have been steadily declining, while the US Dollar has been climbing. There have been two major forces driving investor sentiment, the implications of higher interest rates and disappointment with the current round of quarterly corporate earnings.
In this week’s Equity Leaders Weekly we take a look at the implications of rising US bond yields on markets and signs of a pending downturn in the NASDAQ Composite Index.
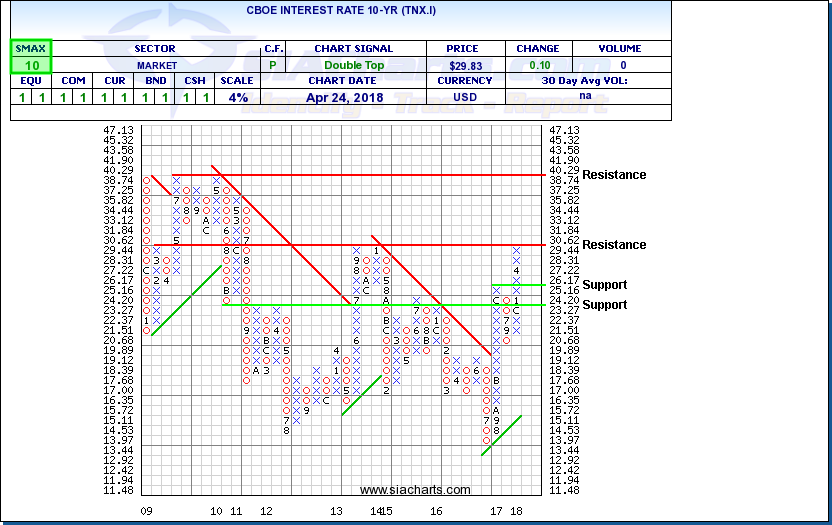
CBOE Interest Rate 10-Year (TNX.I)
Evidence continues to grow suggesting that the low interest rate regime that has dominated world monetary policy this year is coming to an end. This change in the trend of monetary policy has had a significant impact on stocks, commodities and currencies.
Stocks, in particular, had benefitted from low interest rates and accommodative monetary policy as much of the easy money created followed the path of least resistance into world stock markets. The end of easy money, appears to have turned a tailwind into a headwind. The 2016-2018 bull market in stocks came to an abrupt end when the 30-year bond yield broke through the 3.00% barrier. A breakout over that level by the 10-year yield would confirm an upturn in interest rates that could turn a long-term tailwind for stocks into a headwind.
The chart at the right shows the trend in the CBOE 10-year interest rate over the last decade. A long-term downtrend in bond yields bottomed out last summer and since August, there has been growing acceptance that interest rates are on the rise and may continue to do so indefinitely. The move up through 2.617% completed a bullish Double Top, sparking a rally toward a test of the 3.00% round number level. A move up through 3.062% would complete a huge Spread Double Top that would confirm the start of a new uptrend which could send shockwaves through world markets. The next major previous high doesn’t appear until closer to 4.00% on a breakout.
A rising interest rate environment is normal at that point in the economic cycle and is a sign of an improving economy that no longer needs emergency monetary life support. Rising rates have attracted new interest to the US Dollar. The impact on commodities, particularly oil, has been mixed with resource prices caught between the headwind of a higher Dollar and the prospect of higher demand from a strong economy.
NASDAQ Composite Index (NASD.I)
In addition to rising interest rates, changing earnings expectations are impacting what investors are willing to pay for stocks. The bull market of 2016-2018 pushed up valuations and expectations in the technology sector to very high levels. Although the stock market pullbacks of February and March had appeared to ease the problem, the negative reaction to earnings reports from big technology companies like Alphabet (Google) indicate that expectations are still being readjusted downward.
While it’s not a surprise that companies that come in short of estimates are seeing their share prices punished, Alphabet’s decline occurred on concerns about rising expenses and future uncertainty, despite sales and earnings beating expectations. Even Twitter, which had been in a depressed situation where expectations were very low, failed to respond to positive earnings and better than expected sales. This suggests that investors appear to have entered the current earnings season looking for reasons to cash in and go to the sidelines.
Even though an SMAX score of 8 indicates that the NASDAQ Composite continues to show near-term strength against the asset classes, cracks have started to emerge. A recent rally attempt failed at a lower high near 7,305. The index has been slammed back toward 7,000 negating a recent Triple Top breakout and sparking a bearish High Pole Warning that suggests bears have regained the upper hand again. Next potential downside support levels appear near 6,984 then 6,846 and 6,745. Initial resistance falls toward 7,232 and, above that, 7,305.
The next big test for bulls resilience comes Thursday with the reaction to Facebook’s earnings. EPS of $0.36 and sales of $11.9B both came in above expectations, but the data collection scandal hit late in the quarter. It remains to be seen what changing consumer attitudes related to the value and use of personal information and the potential for increased regulation may have on future results but trading in the coming days may indicate if the recent selloff is over or not.
In the coming days, the reaction to reports from high profile technology companies like Amazon.com (Thursday Apr 26), Apple (Tuesday May 1), and Tesla Motors (Wednesday May 2) may provide additional insight into investors’ appetite for technology stocks heading into the spring.

SIACharts.com specifically represents that it does not give investment advice or advocate the purchase or sale of any security or investment. None of the information contained in this website or document constitutes an offer to sell or the solicitation of an offer to buy any security or other investment or an offer to provide investment services of any kind. Neither SIACharts.com (FundCharts Inc.) nor its third party content providers shall be liable for any errors, inaccuracies or delays in content, or for any actions taken in reliance thereon.
For a more in-depth analysis on the relative strength of the equity markets, bonds, commodities, currencies, etc. or for more information on SIACharts.com, you can contact our sales and customer support at 1-877-668-1332 or at siateam@siacharts.com.
Copyright © SIACharts.com