


by John Lynch, Chief Investment Strategist, LPL Financial
The NCAA Men’s Tournament Final Four is set. Kansas, Loyola, Michigan, and Villanova are headed to San Antonio, Texas to determine this year’s college basketball national champion. In that spirit, following our “Sweet 16” commentary last week, this week we share our “Final Four Factors” for the stock market in 2018: economic growth, earnings, trade policy, and the midterm elections. While we expect a hard-fought battle between these factors and with it, more market volatility, we still see the potential for solid gains for stocks this year and maintain our year-end fair value S&P 500 Index target of 2950–3000. We prefer cyclical portfolio positioning, where appropriate, favoring financials, industrials, technology, small caps, and emerging markets.
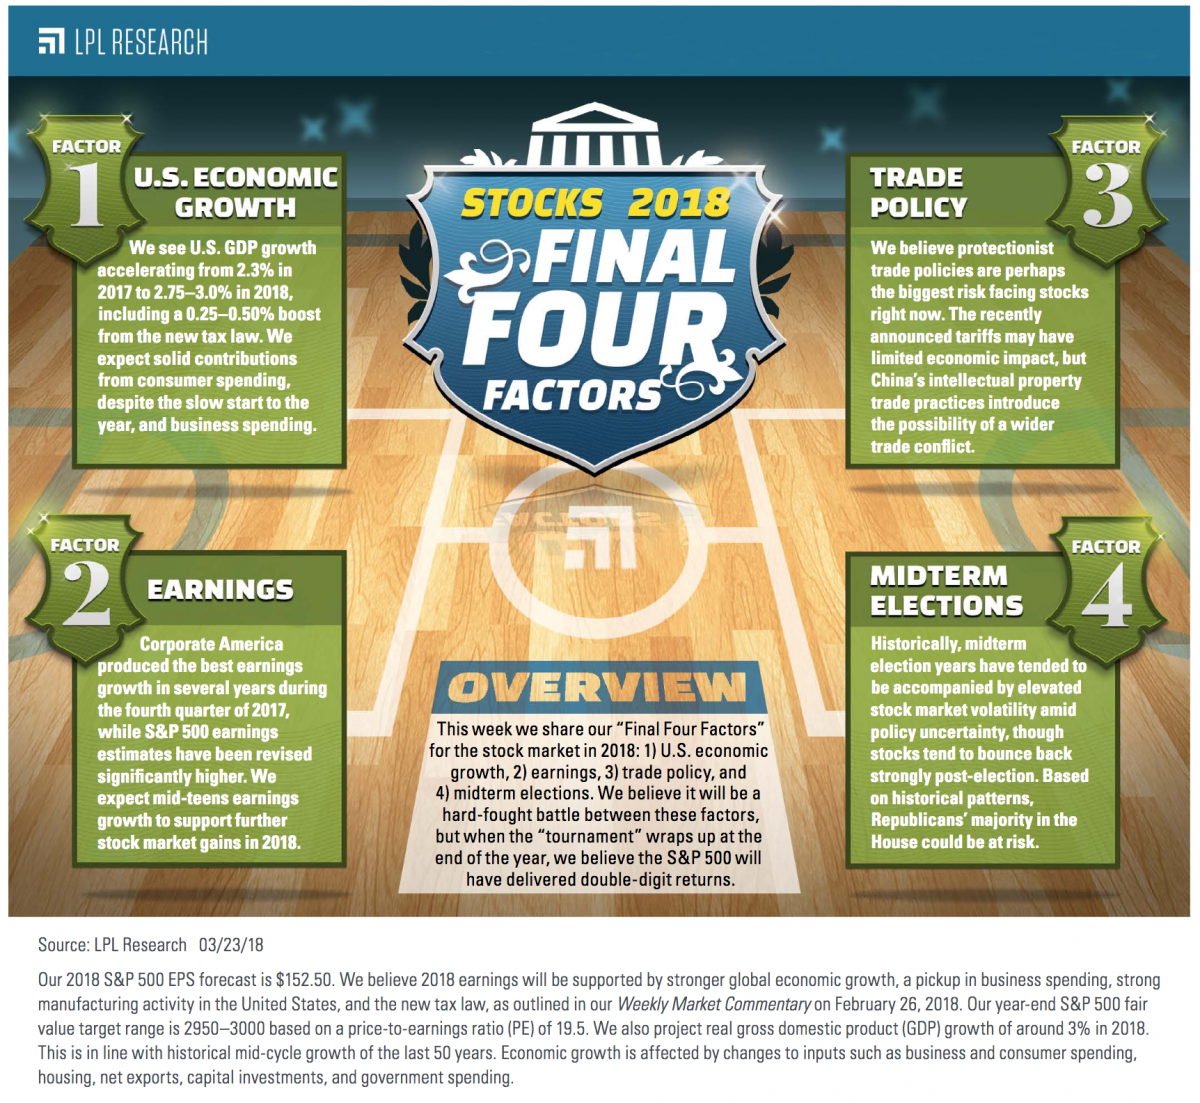
FACTOR #1: U.S. ECONOMIC GROWTH
We see U.S. gross domestic product (GDP) growth accelerating from 2.3% in 2017 to 2.75–3.0% in 2018, including a 0.25–0.50% boost from the new tax law. Though consumer spending has ticked down a bit to start 2017, we expect tax cuts, job and wage gains, and wealth effects to support solid consumer spending growth in 2018. Business spending should get a boost from 100% capital spending prescribed by the new tax law and from repatriation of overseas cash.
Latest developments. Weather depressed first quarter economic data while consumers digested strong spending at the end of 2017. These developments have been corroborated by the reduction in first quarter GDP growth forecasts over the past month: The Atlanta Federal Reserve’s (Fed) GDPNow forecast has fallen from 3.2% to 1.8%, while the New York Fed’s Nowcast forecast has fallen from 3.1% to 2.8%. The slower-twitch first quarter consensus GDP growth figure from Bloomberg, currently 2.5%, has fallen about 0.2% in recent weeks and may soon fall further. Beyond the first quarter, as the impacts of the new tax law flow through economic data and weather-related factors reverse, we expect economic growth to accelerate. Our favorite leading indicators continue to send positive signals.
Bottom line. We still expect 2.75–3.0% GDP growth in the United States in 2018, which should help drive strong corporate profit growth and potentially double-digit stock market gains this year.
Factor #2: EARNINGS
Corporate America produced the best earnings growth in several years during the fourth quarter of 2017 at 15%, while we have seen the biggest positive revision to S&P 500 earnings to start a year since earnings estimate data have been collected. With economic growth improving, manufacturing activity humming, and analysts’ estimates having soared this year, we expect strong mid-teens earnings gains for the S&P 500 in 2018.
Latest developments. Since the end of fourth quarter earnings season in early March, the biggest development is what has not developed — estimates have not been revised lower in response to the recently announced tariffs. Estimates can be slow to react to macro developments, and trade actions take time to affect goods moving across borders, but we interpret this to mean that earnings fundamentals remain solid. It is also noteworthy that the latest wage data suggested that perhaps corporate profit margins may not face as much of a headwind as was feared after a jump in average hourly earnings data for January; wage pressures eased in the February payrolls data released earlier this month.
Bottom line. We expect mid-teens earnings gains for the S&P 500 in 2018. Protectionist trade policies have the potential to be a drag on corporate profitability later this year. However, we anticipate that the potential earnings impact from trade actions out of Washington will be manageable.
Factor #3: TRADE POLICY
We believe protectionist trade policy may be the biggest risk facing stocks right now, a claim that was certainly supported by last week’s market volatility. The recently announced tariffs may have limited overall economic impact (potentially $40 billion globally or less), though certain companies may be hurt. The big concern here is China’s intellectual property trade practices, which the White House sees as the biggest threat, and therefore introduces the possibility of a wider trade conflict.
Latest developments. On March 22, 2018, President Trump announced approximately $50 billion in tariffs on Chinese goods, and warned that more was yet to come, in response to China’s intellectual property thefts. China then retaliated with a smaller set of tariffs on U.S. imports with a value of $3 billion. While it is hard to put a positive spin on tariffs, it is important to keep in mind that the potential value of the announced tariffs, in the $40 billion range, is far smaller than the amount of stimulus going into the U.S. economy in 2018, which could potentially approach $800 billion as discussed in our latest blog.
On the trade front, there are several potentially encouraging developments. First, the China tariffs could be watered down. There is a comment and implementation period that allows time for negotiations and lobbying, while we have seen the Trump administration moderate its positions in other negotiations. Second, the Chinese Premier recently offered concessions, at least verbally, pledging to open up their markets and relax technology transfer requirements for U.S. companies operating there. Third, the newly appointed National Economic Council Chief Larry Kudlow, a noted proponent of free trade, may help moderate U.S. trade policy going forward. And fourth, it is clear that President Trump cares about the stock market; recent stock market volatility has surely gotten his attention.
Bottom line. The potential for a wider trade conflict that impairs economic activity could continue to weigh on investor sentiment in the coming months. When push comes to shove, we expect limited overall economic impact and manageable disruption to corporate America.
Factor #4: MIDTERM ELECTIONS
Historically, midterm election years have tended to be accompanied by elevated stock market volatility related to policy uncertainty. During midterm election years, the S&P 500 experiences an averag drawdown of 17%, about 3% worse than the typical year. It is important, however, to keep in mind that the index tends to bounce back strongly over the subsequent 12 months. History (including 2010 under Barack Obama) and recent state-level election results suggest the Republican’s majority in the House could be at risk. The party’s prospects in the Senate look good at this point.
Latest developments. The government has avoided another shutdown with its $1.3 trillion spending package agreed to on March 23, which could perhaps be considered a win for Republicans (or a loss averted by Democrats). Regardless, that won’t be a political factor in November. Another recent political development is tax reform 2.0 is getting some attention. Recent reports have indicated that Republicans will try to make the individual tax cuts from the new tax law permanent (the law currently sunsets those cuts after 10 years). Because it is not clear how those cuts will be paid for and how needed Democratic votes would be secured, we would say the odds appear low. But if passed, it could give Republicans a political boost.
Bottom line. Stocks may see increased volatility around policy uncertainty during an election year. However, market fundamentals remain healthy, and we are encouraged by the historical pattern of stocks bouncing back strongly from midterm election year weakness. Latest polls and historical midterm election patterns suggest that Republicans’ majority in the House may be at risk, but that the party is likely to hold onto its majority in the Senate.
OTHER POSSIBLE UPSETS
We think trade presents the biggest possible upset for markets, but a central bank policy mistake is another possibility. While the outlook the Fed provided for rate hikes last week was fairly benign in 2018, the outlook for 2019 and 2020 was more hawkish. Our view is that the stock market can manage through the ongoing Fed rate hike campaign, but we acknowledge a Fed policy mistake could provide a potential upset in 2018.
CONCLUSION
Well, there you have it — our “Final Four Factors” for the stock market in 2018: U.S. economic growth, earnings, trade policy, and the midterm elections. We believe it will be a hard-fought battle between these factors, but when the “tournament” comes to a close at the end of the year, we believe the S&P 500 will have delivered double-digit returns.
*****