
For this week’s edition of the Equity Leaders Weekly, we are going to re-examine the Lumber Continuous Contract (LB.F) since we last commented on this back on the October 5th edition of the Equity Leaders Weekly. We will also examine how the Canadian lumber related stocks, specifically West Fraser Timber, has performed throughout this time period now that the US Department of Commerce has re-enforced the previous decision to impose countervailing duties on Canadian Lumber imports this past November.
[Tweet "Lumber and lumber stocks have cont'd higher in spite of US Commerce Dept's punishing tariffs $WFT "]
Lumber Continuous Contract (LB.F)
When we last commented on Lumber in the Equity Leaders Weekly the commodity was approaching a very critical long-term resistance level at $412.80 and a lot has transpired since October. As mentioned, the US Department of Commerce made its final decision and will continue to impose anti-dumping and countervailing duties on softwood lumber from Canada. However, the saga continues as Canada has in turn filed a formal notice to request the establishment of a bi-national panel under NAFTA to review the situation. Canada has also taken its fight to the World Trade Organization (WTO) by filing a complaint over these duties arguing that they violate international law.
 Let’s look at the attached chart for lumber. As mentioned, back on Oct 5th we saw that lumber was approaching a very critical resistance level at $412.80. Since that time, we see that it has broken above this previous resistance later in October. The following two months we see that a pullback had materialized but this pullback reversed to the upside and the commodity continues to make higher highs with its current uptrend still intact. We are now seeing Lumber prices at levels not seen in over 10 years.
The next level of resistance is at the previous high from November at $464.88 and, above that, the psychological $500 level. Support is now at $421.06 and below that, the $396.77. With an SMAX of 7 out of 10, Lumber is showing near term strength against most asset classes.

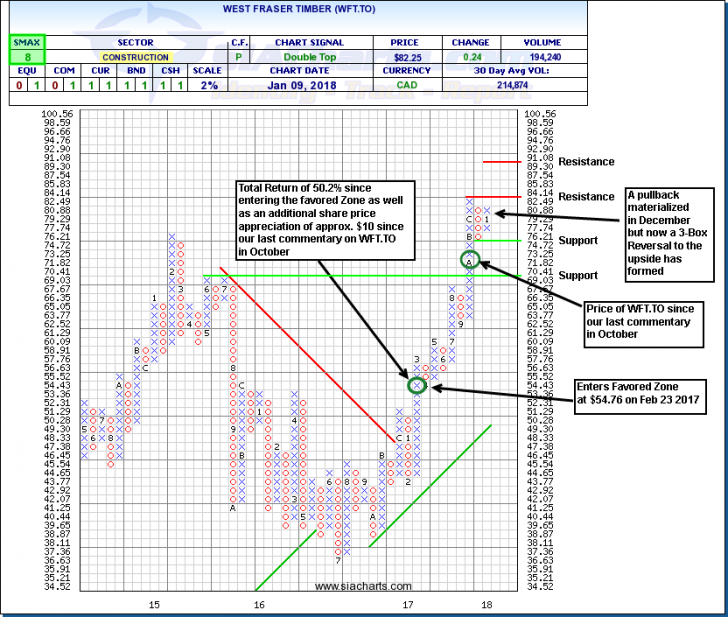
West Fraser Timber (WFT.TO)
Now let’s examine how the lumber-related stocks have performed during this time and have reacted during this uncertain period for the Canadian lumber sector. Many investors and advisors consider the fundamentals when analyzing a sector or investment. As such with the re-enforcement of the US Department of Commerce’s decision to impose these punishing tariffs, intuition would suggest Canadian lumber stocks would have reacted negatively. However, the opposite has occurred as many in the sector have remained quite strong and have continued to make higher highs such as West Fraser Timber and Canfor.
Let’s re-examine the chart of West Fraser since we last commented on it in October. West Fraser Timber is found in the TSX Composite Index Report where it currently occupies the #17 spot. The stock had entered the favored zone of the report back on Feb 23, 2017 at $54.76. As of Jan 9th, the price was $82.25 which is a share price appreciation of over 50.2% in just under a year. It is also higher by 10.00 since our last update on the stock on October 5th when the price was at approximately $72.00.
A fundamentalists viewpoint may have been to exit the position throughout the past year when the US began implementing these tariffs with the final decision imposed back earlier in November may have expedited more selling. However, SIA’s Relative Strength analysis aims to follow money flow dynamics and during the past year the relative strength had not detected any money outflows as the shares have remained firmly in the favored zone of the SIA S&P/TSX Composite Index Report. This is a good example using SIA’s Relative Strength analysis to keep you in winning positions while also maintaining an unbiased viewpoint regardless of the perceived fundamental backdrop that may have been associated with the sector.
In looking at the chart of West Fraser, we see the shares have continued onto higher highs up until December and then a mild pullback materialized. Most recently, however, a 3-Box reversal to the upside has formed and it is very quickly approaching the high reached late last year of $84.14. This will be the next level of resistance. If it manages to break above this level, the next area of resistance is at $91.08. Support for WFT.TO can be found at $74.72 and, below that, $69.03. With an SMAX of 8 out of 10, WFT.TO is showing near term strength against most asset classes.
SIACharts.com specifically represents that it does not give investment advice or advocate the purchase or sale of any security or investment. None of the information contained in this website or document constitutes an offer to sell or the solicitation of an offer to buy any security or other investment or an offer to provide investment services of any kind. Neither SIACharts.com (FundCharts Inc.) nor its third party content providers shall be liable for any errors, inaccuracies or delays in content, or for any actions taken in reliance thereon.
For a more in-depth analysis on the relative strength of the equity markets, bonds, commodities, currencies, etc. or for more information on SIACharts.com, you can contact our sales and customer support at 1-877-668-1332 or at siateam@siacharts.com.