
by Liz Ann Sonders, Brad Sorensen, Jeffrey Kleintop, Charles Schwab and Company
Key Points
- U.S. stocks continue to grind higher, with little appearing able to knock them off course. The possibility of a pullback always exists but a melt up is also reemerging as a real possibility.
- Earnings tend to drive equity market direction, and the next few weeks should help set the tone for market action for the rest of the year. Expectations came down a bit as we entered reporting season and recent robust economic data gives support to the potential for companies to meet and/or beat estimates.
- Global economic growth continues to improve, which should help support both domestic and global stock markets.
Take me out to the ballgame
U.S. stock indices have continued to push to record highs, with little apparently able to throw them off course. The grind higher has pushed through natural disasters, the Las Vegas tragedy, domestic political failures, international political tensions, and missile tests and threats from North Korea—an ample “wall of worry” for stocks to climb. We’re likely entering or already in the latter innings of this long-running bull market and economic expansion, but as baseball fans know there’s still a lot of game left after the middle innings—including the possibility of extra innings. Although there is little of the excess that would suggest recession risk is near, we do see signs that the characteristics of the economy and market may be changing. Bond yields have crept higher, international markets have performed better, and cyclical sectors such as energy and materials have outperformed—all potential signs of the latter stages of a cycle. We’ve seen brief periods when these shifts have occurred before, but the strength and length of the recent moves gives us reason to believe a change in character is afoot.
So what should investors do if we are entering the latter innings? At this point, we suggest making sure strategic allocations are appropriate for risk profiles as well as long-term goals, and make adjustments as needed via tactical rebalancing. There remains the possibility of a pullback, with any number of catalysts possible. Attitudinal measures of investor sentiment are currently showing excess optimism, which is typically a contrarian indicator. This has been a characteristic of most of 2017, but of course we have yet to see a significant pullback. And while attitudinal measures of sentiment appears overly optimistic, behavioral measures still show some caution, with Evercore ISI noting that the net cumulative flows in domestic equity funds (even including exchange-traded funds) continues to be negative, indicating continued caution despite optimistic attitudes.
A melt-up is also reemerging as a possibility should investors’ actions start to follow the attitudinal sentiment indicators. Remember though—as good as a melt-up might feel while underway, they have historically not ended well.
Economy hitting solid doubles, while earnings are stepping to the plate
Another sign that we may be in the latter innings has been the recent acceleration in economic data. Both of the Institute for Supply Management’s (ISM) Surveys had extremely strong readings, indicating accelerating growth. The manufacturing index hit 60.8, the highest level since 2004, while the leading new orders component was a robust 64.6. The service side also looks strong, with the non-manufacturing index rising to 59.8, the best reading since 2005, while the new orders component jumped 5.9 points. Although services represent a much larger share of the U.S. economy, the ISM Manufacturing Index has a higher correlation to the stock market historically.
Strong surveys indicate improving economy
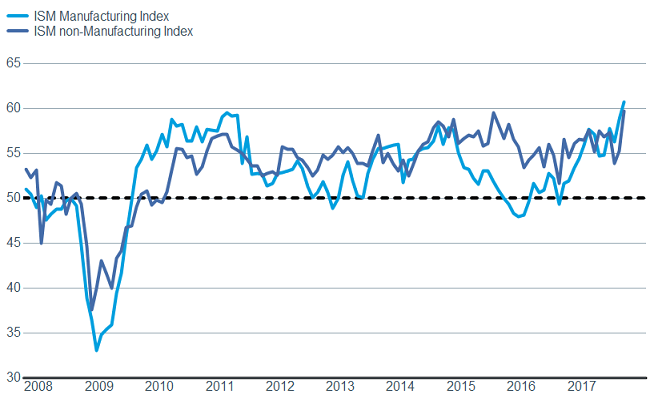
Source: FactSet, Institute for Supply Management. As of Oct. 9, 2017.
Additionally, the U.S. Citigroup Economic Surprise Index has moved back into positive territory, while several measures of capital expenditures have started to move higher.
Economic surprises are positive
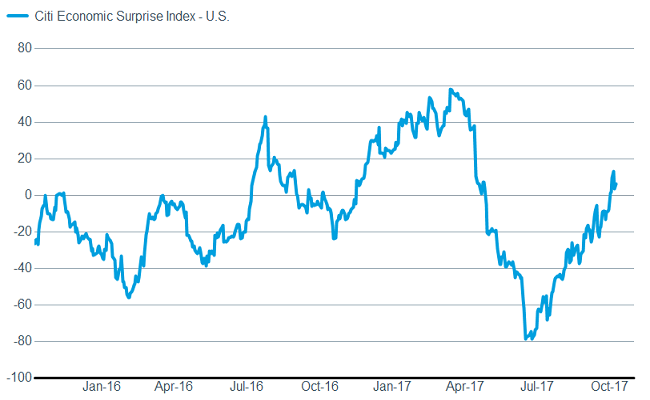
Source: FactSet, Citigroup. As of Oct. 9, 2017.
And capex looks to be improving

Source: FactSet, U.S. Census Bureau. As of Oct. 9, 2017.

Source: Federal Reserve Bank of Philadelphia. As of Oct. 9, 2017.
The labor market also continues to look very healthy, despite the September labor report showing jobs actually declined by 33,000. The market largely ignored the weak jobs number, as the weakness was attributed to the impact from hurricanes; and instead was comforted by the decline in the unemployment rate to 4.2%. More recently, jobless claims—a key leading economic indicator-- have already started to unwind their hurricane-induced weakness.
Jobless claims indicate labor recovering from hurricane weakness

Source: FactSet, U.S. Dept. of Labor. As of Oct. 9, 2017.
We’re finally seeing some indications that inflation is ticking higher. The price component of both ISM surveys jumped, oil has moved higher, and wages are increasing as the labor market tightens. Average hourly earnings (AHE), which are released with the labor report, rose a surprising 2.9% year-over-year, up from an initially-reported 2.5% from the prior month. An alternate measure of wage growth—the Atlanta Fed’s Wage Growth Tracker, which measures median wage growth—is showing an even more robust 3.4% growth in wages.
We may get further insight into the inflation picture with the ramping up of earnings season. Along with overall results, we may get some commentary on pricing power, labor tightness, compensation expenses, and input cost trends. With valuations still elevated, it’s in the market’s best interest for earnings and revenues to continue to outperform expectations. With recent economic data being fairly strong, we are relatively optimistic that the lowered bar of earnings expectations can be met or exceeded.
It’s all about earnings
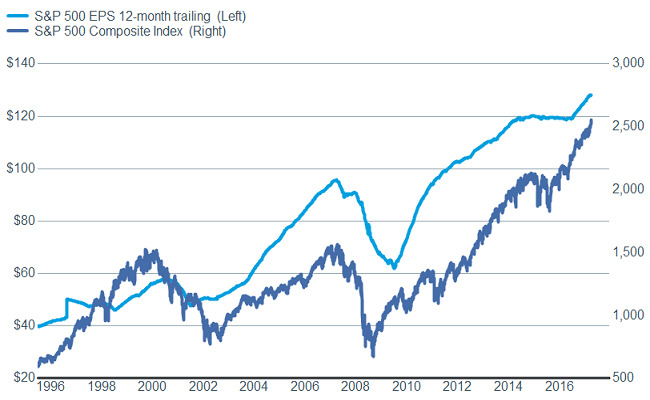
Source: FactSet, Standard & Poor's. As of Oct. 9, 2017. Past performance does not guarantee future results.
Fed as middle reliever, or closer?
The stage in which we current sit is somewhat dependent on the Federal Reserve, which has slowly started to normalize monetary policy by gradually lifting interest rates and beginning to unwind its balance sheet. For now, the Fed is acting like a middle reliever, who tries to keep the score where it is, by not making any drastic moves that may upset investors. But, if some of those measures of inflation continue to rise, the Fed could have to transition to a closer role—who comes in to end the game. A more aggressive Fed could pose a problem for equities, but for now the Fed’s methodical approach to monetary policy tightening is keeping financial conditions loose and the bull market intact
A brighter picture
The global economic and earnings pictures also continue to brighten. After two years of cutting 2017 and 2018 forecasts for global gross domestic product (GDP) growth, economists have been lifting their outlook recently, as you can see in the chart below.
Economists are revising up their forecasts for global economic growth
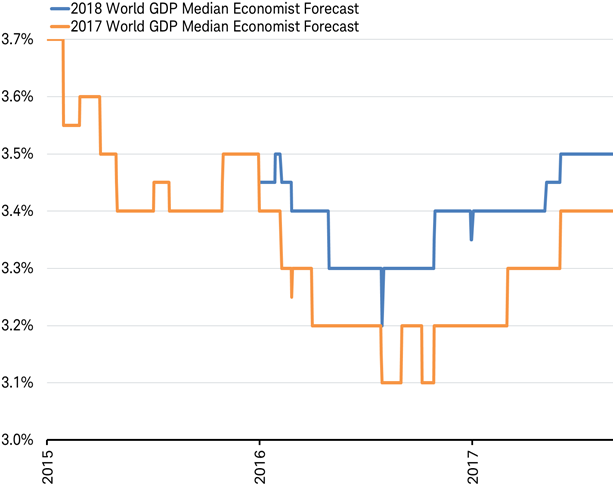
Source: Charles Schwab, Bloomberg data as of 10/11/2017.
This week, the International Monetary Fund (IMF) released its quarterly World Economic Outlook and upwardly revised its forecasts for global growth in 2017 and 2018 to 3.6% and 3.7%, respectively. While the upward revision was modest (+0.1% for both years), the upward revision was very broad with most countries seeing a boost, as you can see in the table below.
Upward revisions to global growth have been across a broad number of economies

Source: Charles Schwab, International Monetary Fund World Economic Outlook October 2017 as of 10/11/2017.
One reason economists have been raising their forecasts is not just that the global economy will likely improve, but also because economic growth has been consistently exceeding their expectations this year for the first time since 2010. The global Citigroup Economic Surprise Index—which is above zero when economic data is exceeding economists’ forecasts—has been positive on average so far this year, after being negative for each of the past six years as actual data fell short of estimates, as you can see in the chart below.
Global economic data is exceeding economists’ expectations in 2017 for first time in years
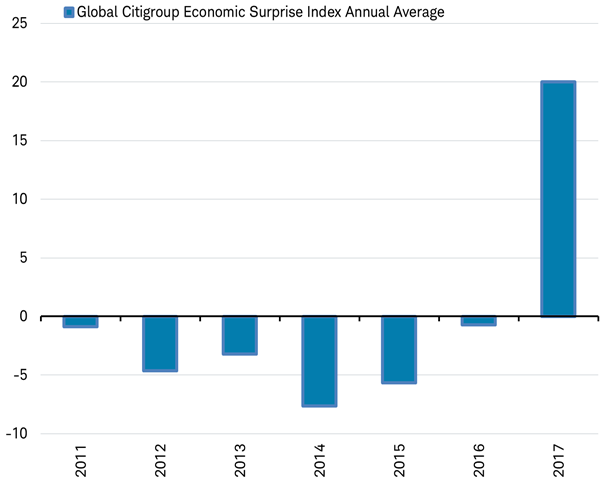
Source: Charles Schwab, Bloomberg data as of 10/11/2017.
Stronger and broader global economic growth has helped lift analysts’ consensus forecast for global earnings per share over the coming year to a new all-time high of $30.63, as of the start of the third quarter reporting season, as you can see in the chart below.
Global earnings hit a new all-time high
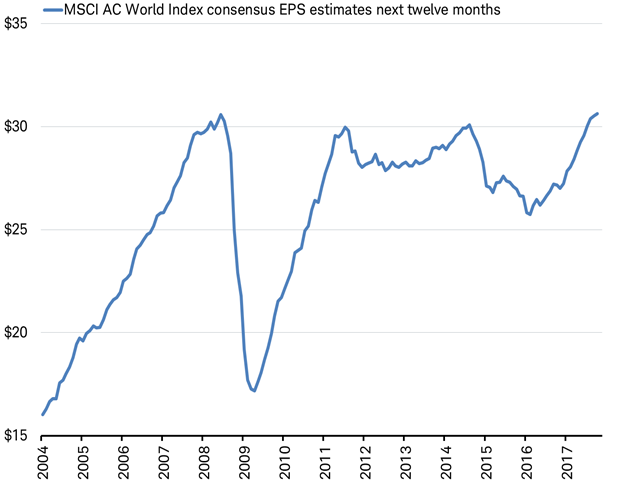
Source: Charles Schwab, Factset data as of 10/11/2017.
The $30 level has been difficult to break though over the past decade, first reaching it in 2008, rebounding to $30 again in 2011 and then again in 2014. Each time earnings hit $30 the global economy stumbled with major economies sliding into recession (read more about what regions have been responsible for the moves both up and down in our recent commentary entitled Earnings May Be About to Do Something They’ve Never Done Before). This time seems to have the makings of a lasting breakthrough as analysts raise their estimates along with economists in response to broadly strengthening global economic growth. A continued rise in global earnings may support further stock market gains.
So what?
A market that could be in or entering the latter innings can provide both opportunities and risk and investors should stay vigilant. Earnings season should propel stocks to further gains but signs of inflation and the potential of a melt-up pose some risks. But our relatively optimistic outlook is bolstered by better global growth, which could keep the game going for a while longer.
Copyright © Charles Schwab and Company