
In light of the Bank of Canada's decision to raise interest rates another quarter point yesterday first, we will take a look at the CADUSD chart, which hit two year highs on Wednesday. Second, we will take a look at how the recent interest rate moves this summer have affected the long end of the yield curve as bond prices generally move in the opposite direction of interest rates.
Canadian Dollar/United States Dollar (CADUSD)
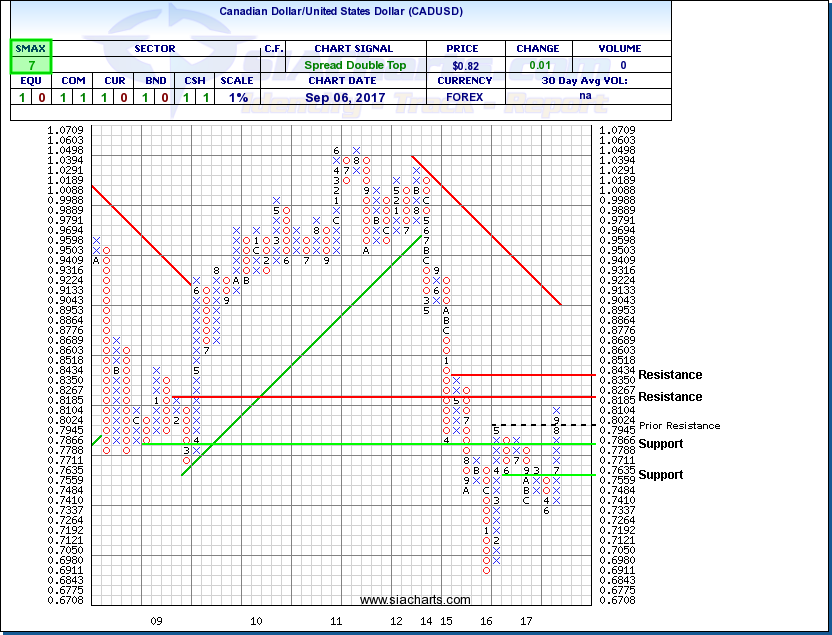
On Wednesday, The Bank of Canada (BoC) raised interest rates for the second time this year after raising rates in July for the first time in seven years. This move has now brought the Loonie to it’s highest level in two years as the BoC raised the target for the overnight rate to 1.00% in a somewhat surprise decision. This rate is now back at the level that it was at the beginning of 2015 when the central bank began slashing rates to combat the collapse in oil prices. The Bank stated, "recent economic data have been stronger than expected, supporting the bank's view that growth in Canada is becoming more broadly-based and self-sustaining." BoC officials had said in July that they were planning to raise interest rates by at least 50 basis points, which is the amount of additional stimulus the central bank provided in 2015 to counter the oil price collapse. While statements from the bank were careful to manage expectations of future rate hikes, adding that “monetary policy decisions are not predetermined and will be guided by incoming economic data,” market-implied odds of another rate increase in 2017 jumped to 66% following the announcement.
The bump in interest rates has pushed the Loonie to two-year highs relative to the greenback and has increased over 6% since the last interest rate hike and ~10% since hitting 2017 lows earlier this year. Turning to the CADUSD point and figure chart (inverse of the USDCAD chart) we can see it has broken above prior resistance and has continued to move up adding 1 more box of X’s on Wednesday and closing at 0.8180. Should this run continue, resistance at 0.8267 may come into play and above that at 0.8434. Support can now be found at 0.7788 and 0.75. With an SMAX of 7 out of 10, CADUSD is showing some near-term strength versus the asset classes.
iShares Core Canadian Long Term Bond ETF (XLB.TO)
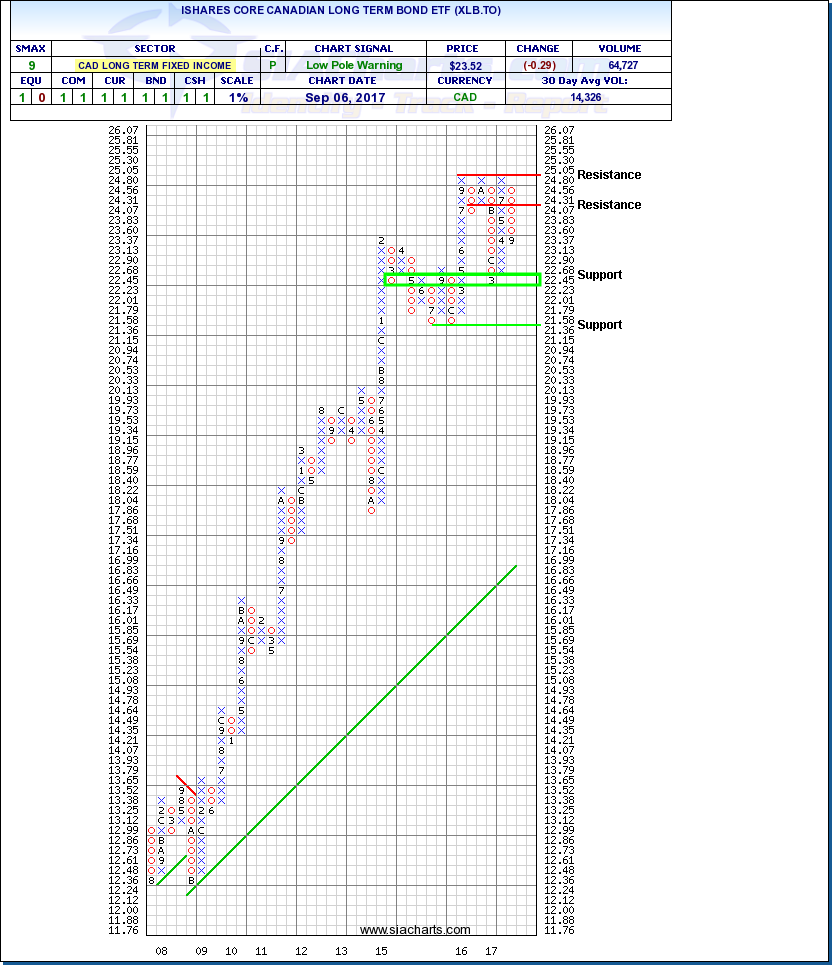
Since yields and bond prices move inverse to each other let’s look at how the long end of the yield curve in Canada has been affected by the recent tightening in monetary policy from the central bank. The iShares Core Canadian Long Term Bond ETF (XLB.TO) seeks income by replicating the performance of the FTSE TMX Canada Long Term Bond Index through holding a portfolio of bonds with maturities over 10 years and an average portfolio maturity of 22 years.
Since peaking in June near all-time highs around $25, we have seen a pullback in XLB.TO of approximately 6%, shown as six boxes of O’s on a point and figure chart where the ETF shares closed at $23.52 on Wednesday. The next level of support comes in around $22.50 and below this at $21.36. Without any further interest rates hikes in the near future we may see a reversal of XLB.TO to test $24 resistance and then possibly make another attempt to overcome the strong resistance at $25. With an SMAX of 9 out of 10, XLB.TO is showing near term strength versus the asset classes.
SIACharts.com specifically represents that it does not give investment advice or advocate the purchase or sale of any security or investment. None of the information contained in this website or document constitutes an offer to sell or the solicitation of an offer to buy any security or other investment or an offer to provide investment services of any kind. Neither SIACharts.com (FundCharts Inc.) nor its third party content providers shall be liable for any errors, inaccuracies or delays in content, or for any actions taken in reliance thereon.
For a more in-depth analysis on the relative strength of the equity markets, bonds, commodities, currencies, etc. or for more information on SIACharts.com, you can contact our sales and customer support at 1-877-668-1332 or at siateam@siacharts.com.
Copyright © SIACharts.com