
by Lance Roberts, Clarity Financial
As I was writing the newsletter this past weekend, the following email rolled into my inbox:
“The S&P will double. And not just eventually. But over the next 5 years (or sooner). Sounds like a Herculean task on the surface, but it’s really not.
My 5-year doubling thesis also means that we won’t see another recession until stocks double again, nor will we see another bear market until stocks double again. Got it?”
The email goes on to make the case as to why the markets will do something that has never occurred before in history, or “why this time is different,” which can be summed up in one word – “Trumponomics”
“It’s no secret that the market has been re-energized this year on the Trump administration’s pro-growth agenda, which includes the highly anticipated corporate tax cuts.
There’s no doubt some of that will go to stock buybacks. But with the US suddenly becoming one of the most business-friendly countries in the world, you will see massive new corporate investment.
These tax cuts alone could usher in decades of new prosperity.
And it should be noted that these aren’t one-time stimulus packages that provide only temporary incentives and modest economic benefits. We’re talking about transformational growth due to long-term structural changes in how companies do business in America.
Instead of the subpar 1.5-2.0% annual GDP that the market has been struggling to achieve over the last 8 years, the economy is expected to double that pace to 3-4%. But even with the weaker than normal economic pace we have been going through, the market in just the last 5 years has produced a total compounded return of 98.2%.
So it’s not hard to imagine that if GDP were to double, earnings would soar, and stocks could easily gain another 100% over the next 5 years, and likely a whole lot more!”
Pretty incredible.
Too bad it’s complete nonsense.
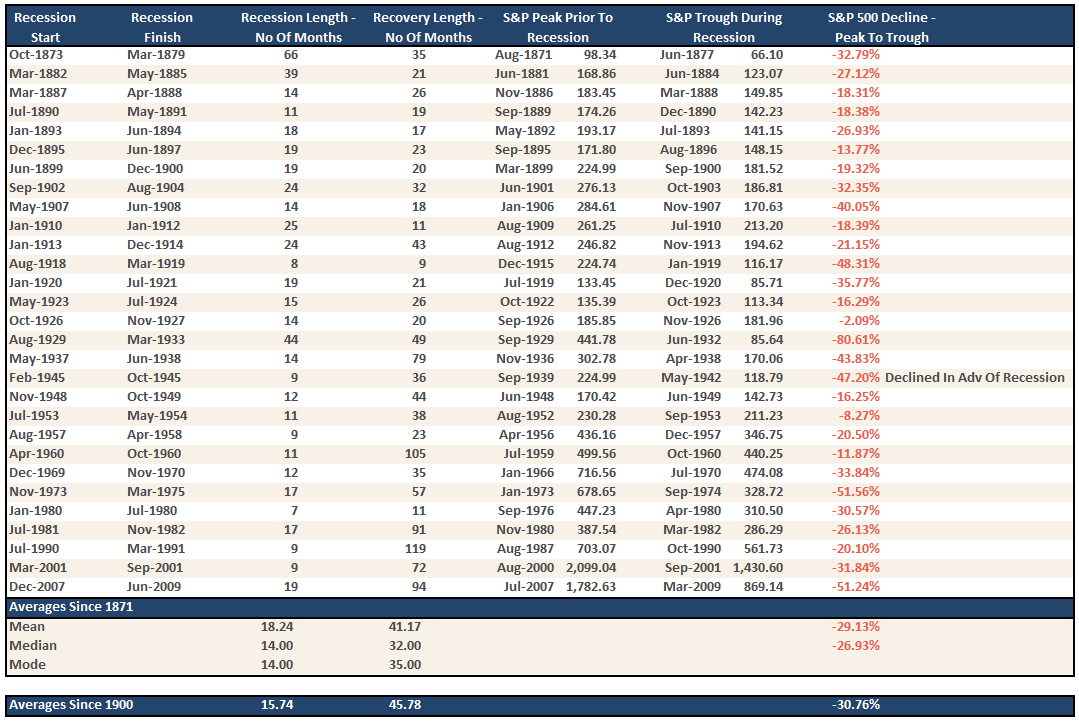
According, to the email, the longest bull market in history was between December 1987 and March 2000 as the market rallied for 12.3 years, gaining 582% along the way. But that’s not exactly true, because as shown in the table below, there was a recession in 1990-91 that lead to a 20% decline in stocks.
However, for the moment, let’s look at the drivers behind the “greatest bull market of all-time.”
Beginning 1983, the secular bull market of the 80-90’s began. Driven by falling rates of inflation, interest rates, and the deregulation of the banking industry, the debt-induced ramp up of the 90’s gained traction as consumers levered their way into a higher standard of living.
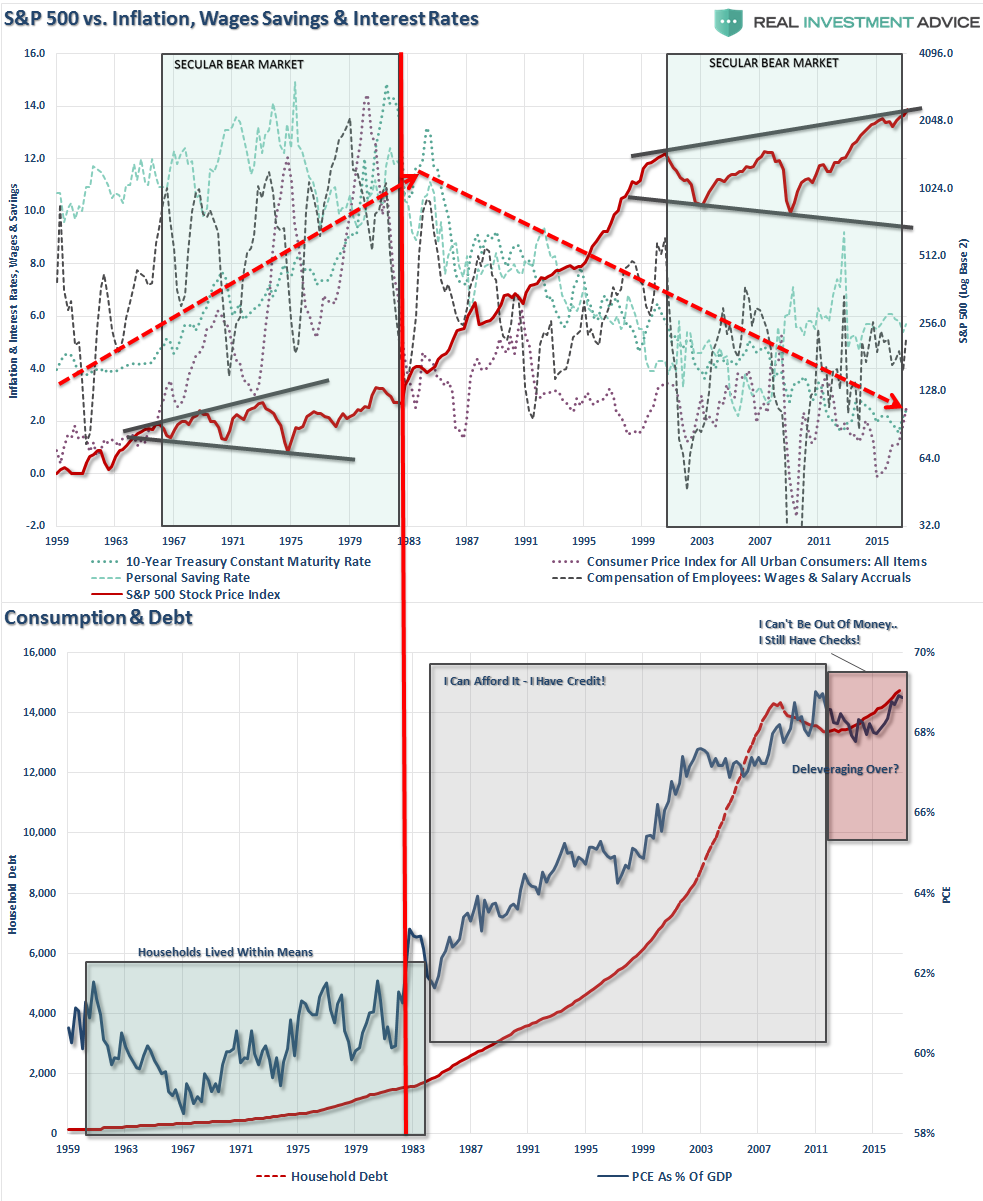
While the Internet boom did cause an increase in productivity, it also had a very deleterious effect on the economy.
As shown in the chart above, the rise in personal debt, which was fostered by 30 years declining borrowing costs, to offset the declines in personal income and savings rates supported the “consumption function” of the economy. The “borrowing and spending like mad” provided a false sense of economic prosperity.
During the boom market of the 1980’s and 90’s consumption, as a percentage of the economy, grew from roughly 61% to 68% currently. The increase in consumption was largely built upon a falling interest rate environment, lower borrowing costs, and relaxation of lending standards. (Think mortgage, auto, student and sub-prime loans.)
In 1980, household credit market debt stood at $1.3 Trillion. To move consumption, as a percent of the economy, from 61% to 67% by the year 2000 it required an increase of $5.6 Trillion in debt.
Since 2000, consumption as a percent of the economy has risen by just 2% over the last 17 years, however, that increase required more than a $6 Trillion in debt.
The importance of that statement should not be dismissed. It has required more debt to increase consumption by 2% of the economy since 2000 than it did to increase it by 6% from 1980-2000.
The problem is quite clear. With interest rates already at historic lows, consumers already heavily leveraged and economic growth running at sub-par rates – there is not likely a capability to increase consumption as a percent of the economy to levels that would replicate the economic growth rates of the past.
“But tax cuts are going to give wage earners a huge boost, right?”
Uhmmm…No.
Despite tax cuts from previous administrations, as shown below, the surge in corporate profitability, particularly in recent years, is a result of a consistent reduction in wage growth. This has been achieved by increases in productivity, technology, and off-shoring of labor.

This drive to increase profitability did not lead to increased economic growth due to increased productive investment and higher savings rates as personal wealth increased. The reality was, in fact, quite the opposite as it resembled more of a “reverse robin-hood effect” as corporate greed and monetary policy led to a massive wealth transfer from the poor to the rich.

It is easy to understand the confusion the writer has from just looking at the stock market as a determinant of economic prosperity. Unfortunately, what was masked was the deterioration of prosperity as debt supplanted the lack of personal wage growth and a rising cost of living.
Most importantly, with respect to “Trumponomics,” as shown with the data above there is NO EVIDENCE tax cuts lead to increases in economic growth rates, higher levels of consumption or personal prosperity. As I noted just recently:
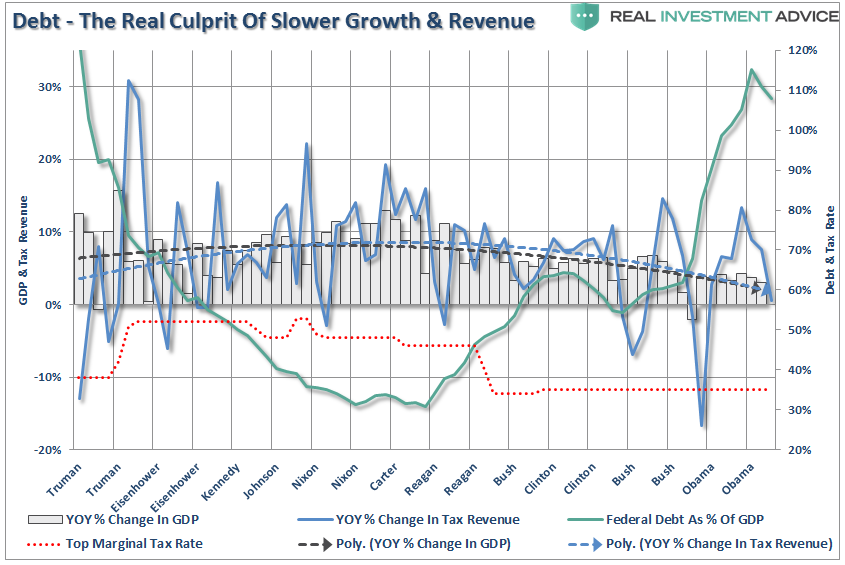
“The differences between today’s economic and market environment could not be starker. The tailwinds provided by initial deregulation, consumer leveraging and declining interest rates and inflation provided huge tailwinds for corporate profitability growth. The chart below shows the ramp up in government debt since Reagan versus subsequent economic growth and tax rates.
Of course, as noted, rising debt levels is the real impediment to longer-term increases in economic growth. When 75% of your current Federal Budget goes to entitlements and debt service, there is little left over for the expansion of the economic growth.”
“The tailwinds enjoyed by Reagan are now headwinds for Trump.”
Do not misunderstand me. Tax rates CAN make a difference in the short run particularly when coming out of a recession as it frees up capital for productive investment at a time when recovering economic growth and pent-up demand require it.
Where you are in the current macroeconomic cycle has everything to do with the benefit you receive from economic stimulus. Given we are in the third longest economic expansion in history, it is quite unlikely any type of tax reform will have much impact on creating higher rates of economic growth.
In other words, we are holding the wrong end of the stick.
While it is quite apparent the ongoing interventions by Central Banks have boosted asset prices higher, there has been little improvement in economic prosperity. The widening wealth gap between the top 10% of individuals that have dollars invested in the financial markets, and everyone else, continues to expand.
However, while increased productivity, stock buybacks, and accounting gimmicks can certainly maintain an illusion of corporate profitability in the near term, the real economy remains very subject to actual economic activity. The inherent inability to re-leverage balance sheets, to any great degree, to support further consumption provides an inherent long-term headwind to economic prosperity.
While the “bullish” mantra of an additional doubling of the S&P 500 is certainly appealing, from an economic perspective it is quite impossible to replay the secular bull market of the 80-90’s. While I would certainly welcome such an environment, the more likely scenario is a repeat of the 1970’s. The trick will be remaining solvent for when the next secular bull market does indeed eventually arrive.
Lance Roberts

Lance Roberts is a Chief Portfolio Strategist/Economist for Clarity Financial. He is also the host of “The Lance Roberts Show” and Chief Editor of the “Real Investment Advice” website and author of “Real Investment Daily” blog and “Real Investment Report“. Follow Lance on Facebook, Twitter and Linked-In
Copyright © Clarity Financial