
by Lance Roberts, Clarity Financial
As the first quarter of 2017 closes, April begins the last leg of the markets “seasonally strong” period of the year, which is where the idea of “Sell In May And Go Away” comes from. And, of course, every year, there is always a litany of articles written about why it is such a bad idea, you need to just “buy and hold”, blah…blah…blah.
Yes, there are years where the markets rise during the summer months, but more importantly, it is those years that don’t which cause the most damage. Last year, selling in May, saved investors the emotional trauma of the Brexit plunge in June and the pre-election angst in November.

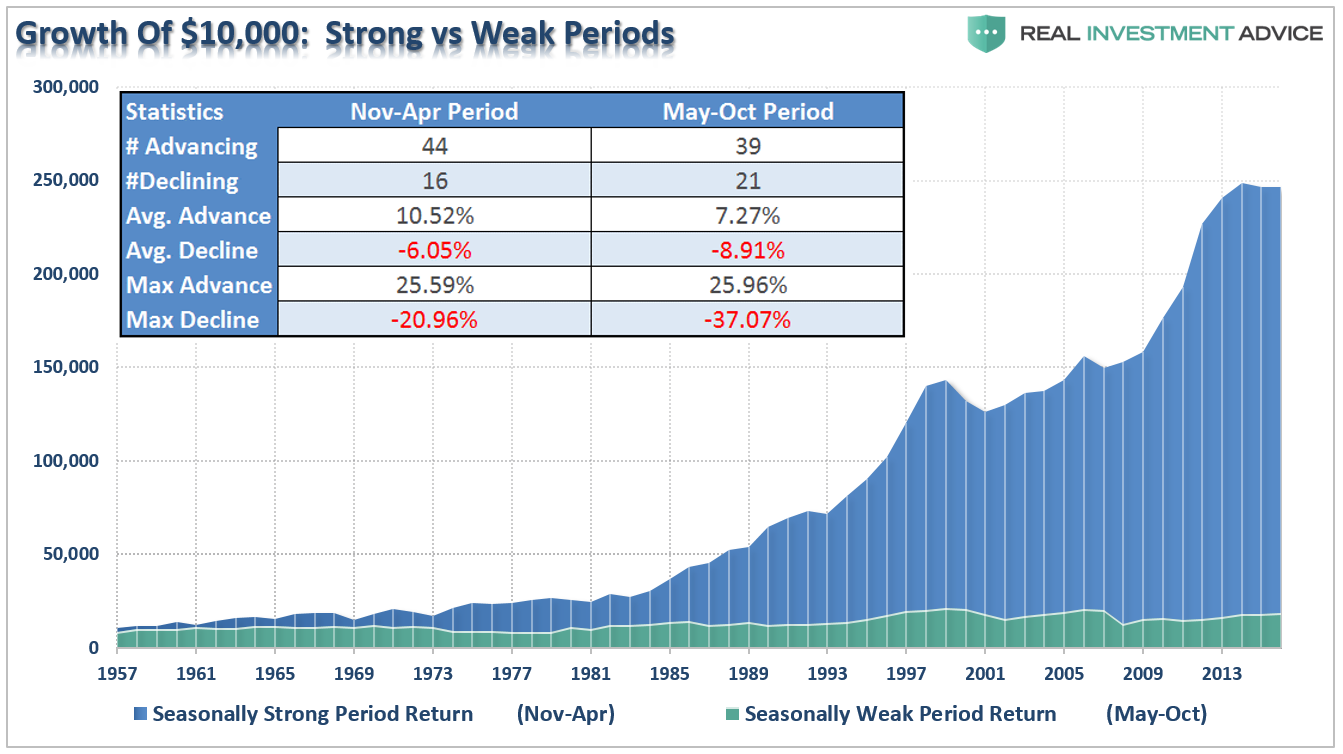
Importantly, “selling in May” does not necessarily mean “going all to cash,” so can we please stop using extremes to try and prove a point. “Selling In May,” at least in my world, is the process of reducing risk during a period time where historical returns have tended to be poor. Take a look at the chart below which shows a $10,000 investment into markets during the “Seasonally Strong” vs. “Seasonally Weak” periods. Did you really miss anything by skipping the summer months?
During this past weekend’s 2017 Economic and Investment Summit, Greg Morris, author of “Investing With The Trend” made a salient comment about “Sell In May & Go Away.”
“Let’s assume the statistics suggest that 75% of the time ‘Selling In May’ is a profitable strategy. As an investor, those are odds worth banking on.
However, as soon as you try it, the strategy doesn’t work. In fact, it doesn’t work over the following three years. So, as an investor, you quit the strategy because it doesn’t work. Right?
Wrong? You just experienced some of the 25% of the time the strategy doesn’t work and with each year the strategy fails to work, the odds increase of a profitable return in the subsequent year.”
The statistics are undeniable. Reducing risk in the summer months has benefited investors more often than not. However, given the focus of commentators, journalist and Wall Street to create action, the long-term benefit is lost to the short-term headline.
Let me paraphrase Greg’s conclusion:
“The two biggest keys to winning the long-term investment game are patience and discipline.“
Unfortunately, patience and discipline are extremely rare commodities for individual investors today.
Which brings me to margin debt.
Margin Debt Hits Record, Nothing To Worry About?
Just recently, there was a Twitter flurry of discussion regarding the recent surge in margin debt to an all-time record. As noted by the WSJ:
“Rising levels of margin debt are generally considered to be a measure of investor confidence. Investors are more willing to take out debt against investments when shares are rising and they have more value in their portfolios to borrow against.
But a steady chug higher to record levels can indicate that investors are losing sight of market risks and betting that stocks can only go up. Margin debt has a history of peaking right before financial collapses like the ones in 2000 and 2007.”
But many suggest that high levels of margin debt, in and of itself, is relatively meaningless.
However, as I will explain, I both agree, and disagree.
First, some context, as shown in the chart below, on a quarterly basis, the market is currently more overbought than at just about any other point in history. The vertical red lines denote the bear markets that occur from these levels. Importantly, note the current conditions HAVE NEVER lasted indefinitely.

Besides the markets being more extended, bullish and overvalued than at virtually any other point in history, they are currently more levered as well. The NYSE released its latest margin debt figures for February which shows investors piled on leverage pushing levels to all-time highs.
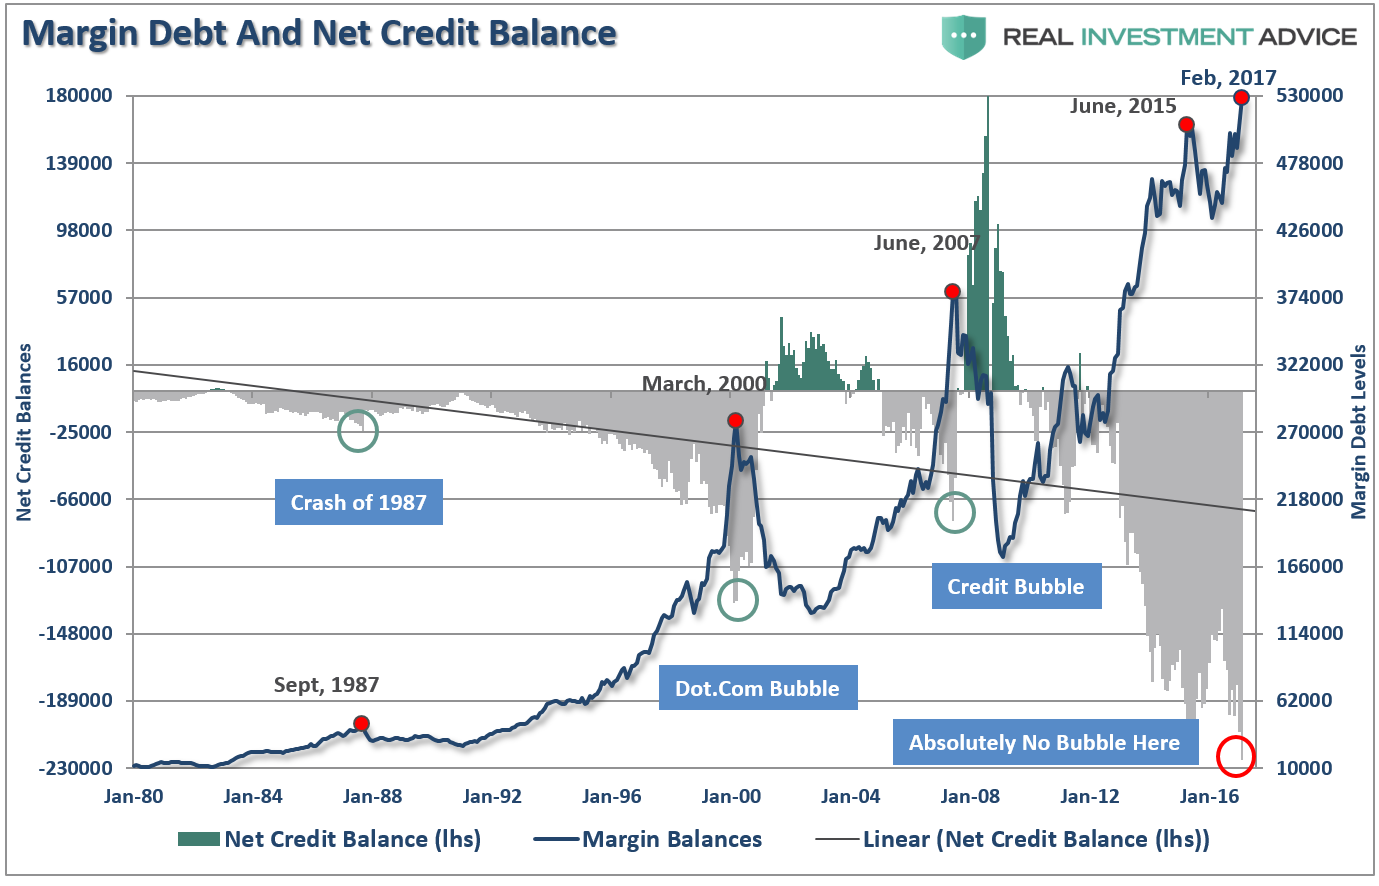
It is worth noting that when net credit balances have plunged very negative levels it has been the “fuel” for a major mean reverting event at some point in the future.
As I stated above, I both agree and disagree with the statement that margin debt levels are simply a function of market activity and have no bearing on the outcome of the market.
By itself, margin debt is inert.
Investors can leverage their existing portfolios and increase buying power to participate in rising markets. While “this time could certainly be different,” the reality is that leverage of this magnitude is “gasoline waiting on a match.”
When an event eventually occurs, it creates a rush to liquidate holdings. The subsequent decline in prices eventually reaches a point which triggers an initial round of margin calls. Since margin debt is a function of the value of the underlying “collateral,” the forced sale of assets will reduce the value of the collateral further triggering further margin calls. Those margin calls will trigger more selling forcing more margin calls, so forth and so on.
Notice in the chart below that margin debt reduction begins innocently enough before accelerating sharply to the downside. This time will likely be no different.

Last week, Jonathan Tepper (@jtepper2) asked about margin debt as a percent of the economy.
The idea is that since the stock market should be somewhat reflective of underlying economic activity, then the correlation between the markets, leverage, and economic growth should provide some clues as to future outcomes. Unfortunately, it does.
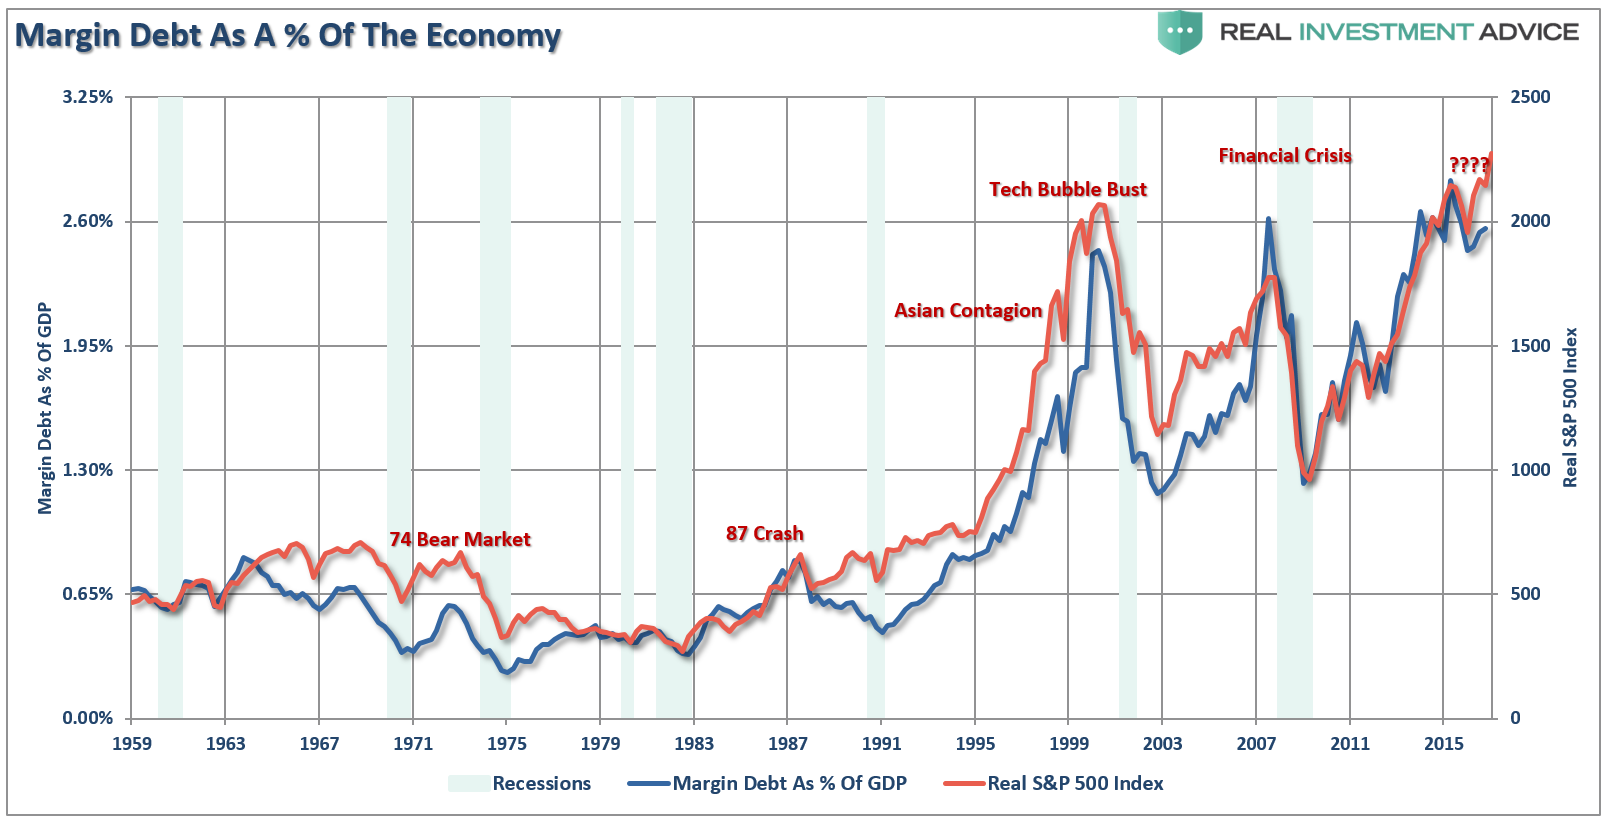
Jonathan also took it from an interesting perspective as well considering disposable personal incomes. To wit:
For all those that hate margin debt charts. Enjoy. Not a timing tool, but looks at margin debt vs real economy as denominator. pic.twitter.com/DW35bGgZz9
— Jonathan Tepper (@jtepper2) April 2, 2017

Spikes in the margin debt to market capitalization ratio have been historically consistent with short-term market peaks and the beginning of major corrections. Currently, the recent spike higher has led to some stagnation in the market and will be worth watching as we head into the seasonally weak summer months.
Here is the important point. It is not the rising level of debt that is the problem, it is the decline which marks peaks in both market and economic expansions.
A Technical Take
Now, my friend Greg Morris absolutely hates it when people apply technical analysis to economic data. However, I hope he will grant me a consideration here because I think it is a fruitful exercise.
The following three charts examine margin debt as it relates to the financial markets by utilizing the 12-month moving average, relative strength, and stochastic analysis. Unlike a stock price chart, we are using the technical analysis, in this case, to understand how aggressively investors are leverage up portfolios as a sign of excessive exuberance, or capitulatory buying.
The first is the 12-month moving average of margin debt. When margin debt has fallen below the 12-month moving average, it has been indicative of market corrections. The blue highlights are where margin debt did dip below its 12-month average which corresponded with trouble in the markets. Currently, with margin debt levels well above the average, it was not surprising to see the markets move higher in February. However, given the recent struggles in March, it would suggest some correction in leverage has occurred. But currently, the trend in margin debt remain positive suggest the bullish backdrop for investors remains supportive for the remainder of the seasonally strong period.

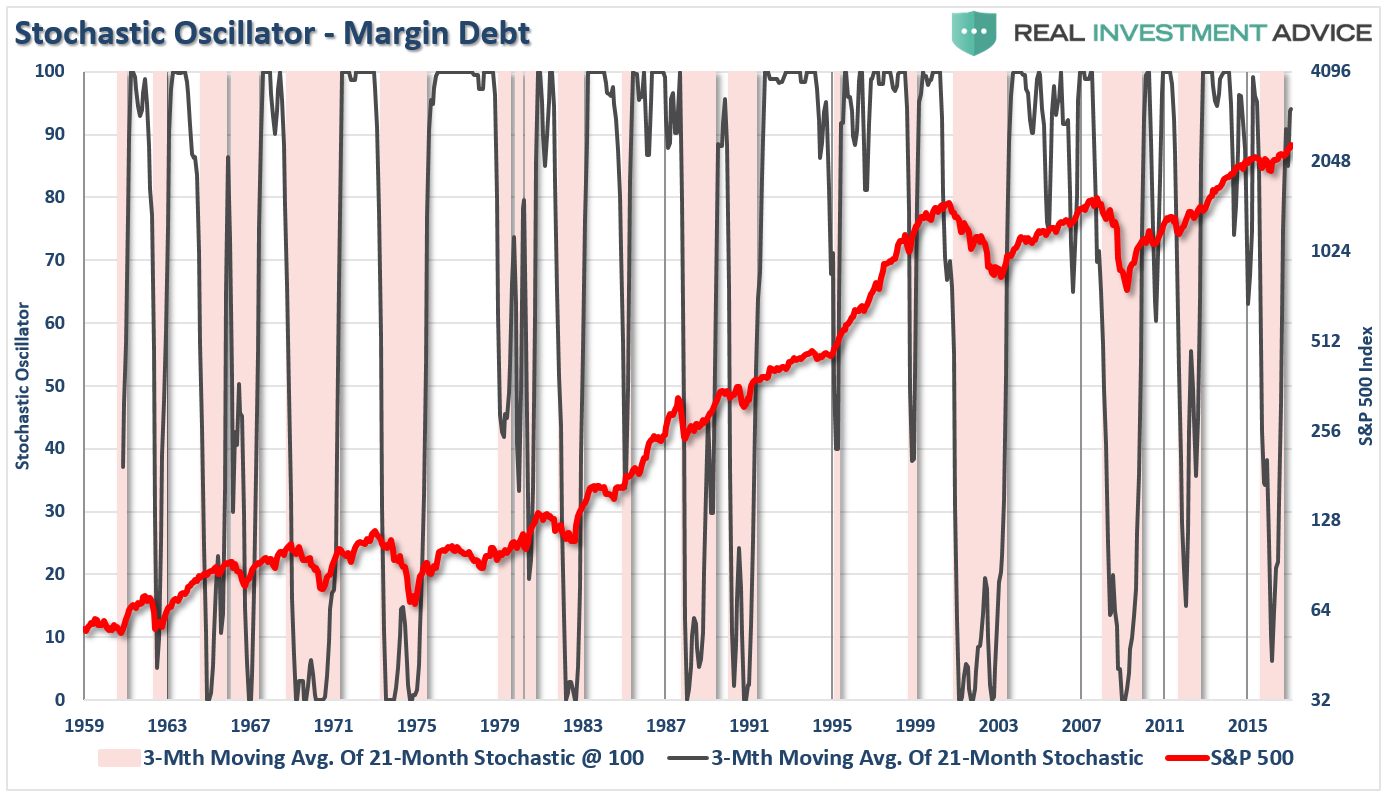
The next chart is a Stochastic Oscillator of margin debt. The vertical red bars highlight when the oscillator has declined below 50 on a scale of 0 to 100. As with margin debt itself, it is not the increase of the oscillator that is important but rather the decline. When the oscillator falls BELOW 50, and approaches ZERO, is when the markets have either been in short-term corrections or full blown reversions. As of February, the oscillator had recovered from its pre-election correction and is once again approaching 100. This suggests, the current bull market remain intact for now and could remain throughout the remainder of the seasonally strong period. However, be on the lookout for summer weakness from a timing standpoint.
The relative strength index of margin debt is also another way to look at how fast investors are leveraging up portfolios. As discussed above, when margin debt is rising strongly, so are the markets. Conversely, when market participants become worried about the markets and begin to unwind leverage, which requires selling, that markets have historically run into trouble.

It is when margin debt’s RSI has exceeded 80, and begins to decline, which has generally been indicative of short-term corrections and major market declines. RSI peaked above 80 prior to the election and declined as the markets ran into trouble over the concerns of a “Trump Election.” However, that negativity quickly reversed election night as the “Trump Trade” got underway and fueled a resurgence of buying exuberance with investors levering up their portfolios once again.
With RSI now climbing back towards 80, as with the stochastic indicator above, it suggests the current bullish trend remains intact most likely for the remainder of the seasonally strong period. However, there have been periods where the market reversed with the RSI at levels lower than 80, so don’t get complacent.
Since the markets remain near all-time highs, does this mean the indicator is flawed and should not be paid attention to? Hardly. What it does suggest is that much like the late 90’s, exuberance is pressing stocks higher even as many of the underlying technical and fundamental indicators suggest this should not be the case.
Conclusion
These different measures of margin debt all suggest that investors should be cautious of the markets currently. While the bullish trend currently remains intact, and will likely remain so for the remainder of the seasonally strong period, it doesn’t mean investors should become overly complacent. Risks of a more substantial correction have risen due to a deterioration in economic data, fundamental data and the length of time itself.
Currently, margin debt is still rising as the “fear of missing out” on potential upside in the market is trumping longer-term logic of risk management and portfolio controls. However, this has always been the case with investors historically as the chase for returns leads to “buying tops” and “selling bottoms.” This time will very likely turn out similarly.
As I stated, the important thing to remember about margin debt is that alone it is inert and poses no real danger to the market. However, when combined with the correct catalyst, it will act as an accelerant to a market correction when forced liquidations fuel additional selling.

Few investors have survived the corrections that in hindsight were deemed “obvious.” However, in the short-term, these dangers remain dismissed as the markets continue to climb a “wall of worry.”
But that is a climb that does not last forever.
Lance Roberts

Lance Roberts is a Chief Portfolio Strategist/Economist for Clarity Financial. He is also the host of “The Lance Roberts Show” and Chief Editor of the “Real Investment Advice” website and author of “Real Investment Daily” blog and “Real Investment Report“. Follow Lance on Facebook, Twitter and Linked-In
Copyright © Clarity Financial