by Frank Holmes, CIO, CEO, U.S. Global Investors
Share this page with your friends:
Please note: The Frank Talk articles listed below contain historical material. The data provided was current at the time of publication. For current information regarding any of the funds mentioned in these presentations, please visit the appropriate fund performance page.
March 6, 2017

Last week I was in Vancouver attending YPO EDGE, the annual summit for business executives from more than 130 countries. YPO, which stands for Young Presidents’ Organization, has roughly 24,000 members worldwide. Together, they employ 15 million people and generate a massive $6 trillion in revenue annually.
What I appreciate about YPO is that it stresses peer-to-peer learning. Those who think it’s all about networking and cutting deals are missing the point.
The theme this year was disruption—how innovative breakthroughs in technology, medicine, transportation, machine learning and more have transformed, and will continue to transform, the world we live and work in.
 |
“Disrupt, or get disrupted,” John Chambers, executive chairman and former CEO of Cisco, said during his conversation with CNBC’s Tyler Mathisen.
Chambers was speaking specifically of what he calls the “digital era,” which will soon replace the information age. The internet of things is expanding very aggressively right now, but it’s still in its infancy. In 10 to 15 years, Chambers says, more than 500 billion devices worldwide will be connected to the internet. This will irrevocably change how we live our daily lives, conduct business, deploy health care, invest and more.
So what does this mean? For one thing, Chambers estimates that as much as 40 percent of companies now in operation around the world will not exist “in a meaningful way” sometime within the next two decades. To survive, companies will need to reinvent themselves by integrating digitization into the fabric of their business strategy. In the world Chambers imagines, every company will be, at its core, a technology company, and data will become the new oil.
After his presentation, I had the pleasure to share a few words with Chambers in private. I was amazed to hear that, during his tenure as CEO in the 1990s, Cisco had an unbelievable compound annual growth rate (CAGR) of 65 percent. I was even more amazed to hear that he managed to turn 10,000 of his employees into millionaires. I don’t know if that’s a record, but it wouldn’t surprise me if it was. He told me that he wouldn’t be able to do the same today because of our current tax laws. In any case, Chambers embodies all that makes America great—curious, innovative, forward-thinking and willing to share his share his success with his employees.
How to Pick Home Run Stocks, According to Moneyball
A lot of what Chambers talked about during his presentation reminded me of one such disruptor, Billy Beane, the former general manager of the Oakland A’s and subject of Michael Lewis’ 2003 bestseller Moneyball: The Art of Winning an Unfair Game, which was later turned into a 2011 film starring Brad Pitt. Despite being about baseball, it’s one of the best books on stock-picking ever written.
 |
For those unfamiliar, Moneyball tells the story of the A’s’ famous 2002 season and Beane’s efforts to build a competitive team despite a lack of revenue and the recent loss of several key players, among other disadvantages. Making matters worse, conventional factors for selecting new players—long perpetuated by the “wisdom” of industry insiders—had grown stale, antiquated… and just plain wrong. Appearance, personality and other biased perceptions were still very much part of the selection process.
With little else left to lose, Beane focused on what he felt were better indicators of offensive performance, including on-base percentage and slugging percentage. This allowed him to cut through the biases and find overlooked, undervalued, inexpensive players. “An island of misfit toys,” as Jonah Hill’s character Peter Brand puts it in the movie.
Beane, in other words, became a value investor—one who depended not on emotion or “instinct” but empiricism and quantitative analysis. All of the picks who fell into his model were mathematically justified.
The strategy worked better than anyone expected. Although the A’s had one of the lowest combined salaries in Major League Baseball, they finished the year first in the American League West. Their winning streak of 20 consecutive wins that season remains the longest in American League history.
Beane changed the game—literally. Today, nearly every club in the MLB relies on “sabermetrics,” or baseball statistics, to select players. This helps them develop a “portfolio” of constituents whose overlooked potential gives the club the greatest odds possible of outperforming the “market.”
Finding Frugal Miners
As active managers, we try to do the same. Like Beane, we use a host of quantitative, top-down and bottom-up factors to help us find the most undervalued precious metals and resource stocks.
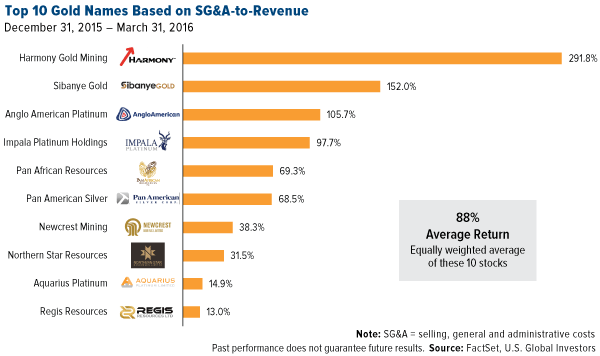
One such factor, low SG&A-to-revenue, I shared with you back in September. “SG&A” stands for “selling, general and administrative expenses” and refers to the daily operational costs of running a company that are not related to making a product. It stands to reason that a company with lower-than-average expenses relative to its revenue might have wider margins than a company with oversized expenses, but few investors look at this metric outside of quants.
Using this factor, we found 10 names whose average returns in the first quarter of 2016 amounted to a phenomenal 88 percent—nearly double what the Market Vectors Gold Miners ETF (GDX) returned over the same three-month period.
Of course, a company must meet several other factors before it qualifies for our models, but this is just one example of the type of rigorous quantitative analysis we conduct.
Probability Is in the Pudding
In Moneyball, Lewis quotes Dick Cramer, cofounder of STATS, a sports statistics company: “Baseball is a soap opera that lends itself to probabilistic thinking.”
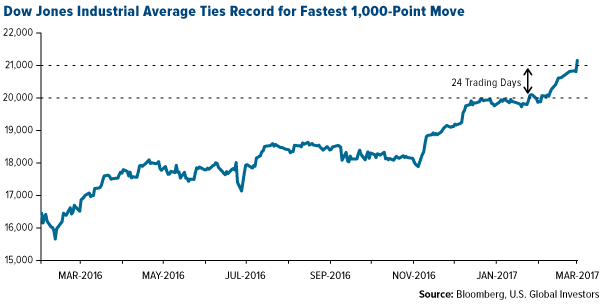
The world of investing is the same, and lately there’s been no better soap opera than watching the major indices hit near-daily all-time highs on hopes that President Donald Trump and the Republican-controlled Congress can lower taxes, slash regulations and find the money to invest in the military and infrastructure. On Monday last week, the Dow Jones Industrial Average posted its 12th straight day of gains, a winning streak we haven’t seen in 30 years. And on Wednesday, it tied a previous record, set in 1987, for the fastest 1,000-point move. It took only 24 trading days for the Dow to surge from 20,000 to 21,000. (Since then it’s fallen below that mark.)
But like baseball, investing lends itself to probability thinking, and here we have experience as well.
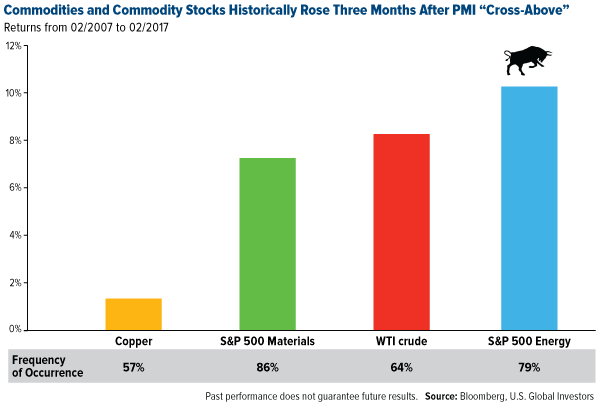
As I’ve said a number of times before, we closely monitor the monthly Global Manufacturing Purchasing Managers’ Index (PMI) because it’s forward-looking rather than backward-looking, like gross domestic product (GDP). As such, we’ve found a high correlation between the PMI reading and the performance of commodities and energy one, three and six months out. When a “cross-above” occurs—that is, when the monthly reading crosses above the three-month moving average—it has historically signaled a possible uptrend in crude oil, copper and other commodities. Our research shows that between February 2007 and February 2017, the S&P 500 Energy Index rose 10.2 percent, 79 percent of the time after a “cross-above,” while the S&P 500 Materials Index rose 7.2 percent, 86 percent of the time. Knowing this helps us anticipate the opportunities ahead.
In February, the global PMI rose to 52.9, a 69-month high. It was also the sixth straight month of manufacturing expansion, which bodes well for commodities, materials, miners and other key assets we invest in.
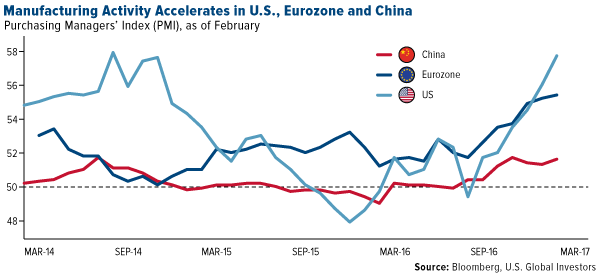
Individual PMI readings for the U.S., eurozone and China—which together make up about 60 percent of global GDP—all advanced in February.
The eurozone’s reading of 55.4 was its highest since April 2011, with expansion being led by the Netherlands, Austria and Germany. The region is more optimistic about the future than at any time since the debt crisis, and the weakened euro has provided a welcome tailwind to help boost sales and exports.
China’s PMI held above 50.0, indicating industry expansion, for the seventh straight month in February on improved new order inflows, higher demand and greater optimism.
The U.S., meanwhile, ended the month with an impressive 57.7, its highest reading since August 2014. Of the 18 manufacturing industries that are tracked, 17 reported growth, including machinery, computer and electronic products, metals, chemical products and others. New orders rose significantly, from 60.4 in January to 65.1 in February, as did backlog of orders, which advanced a whopping 7.5 percent.
Mark Your Calendars!
Join me later this month in St. Petersburg, Florida, for the 19th Anniversary Investment U conference! I’ll be speaking on gold, airlines and infrastructure. Tickets are now available. I hope to see you there!
Some links above may be directed to third-party websites. U.S. Global Investors does not endorse all information supplied by these websites and is not responsible for their content. All opinions expressed and data provided are subject to change without notice. Some of these opinions may not be appropriate to every investor.
Holdings may change daily. Holdings are reported as of the most recent quarter-end. The following securities mentioned in the article were held by one or more accounts managed by U.S. Global Investors as of 12/31/2016: Harmony Gold Mining, Northern Star Resources, Regis Resources, Sibanye Gold.
The Dow Jones Industrial Average is a price-weighted average of 30 blue chip stocks that are generally leaders in their industry. The S&P 500 Energy Index is a capitalization-weighted index that tracks the companies in the energy sector as a subset of the S&P 500. The S&P 500 Materials Index is a capitalization-weighted index that tracks the companies in the material sector as a subset of the S&P 500.
The Purchasing Manager’s Index is an indicator of the economic health of the manufacturing sector. The PMI index is based on five major indicators: new orders, inventory levels, production, supplier deliveries and the employment environment.
This post was originally published at Frank Talk.
Copyright © U.S. Global Investors


