by Ryan Detrick, LPL Research
Searching for seasonal patterns in history can be a useful additional tool when analyzing sector performance and looking for a new idea. Here in March, we are encouraged by four sectors’ seasonal tendency to outperform the S&P 500 Index: energy, financials, consumer discretionary, and industrials. This relative outperformance stands out in our review of the last 20 years of S&P 500 returns in March, a month in which the index has on average generated positive returns 65% of the time.
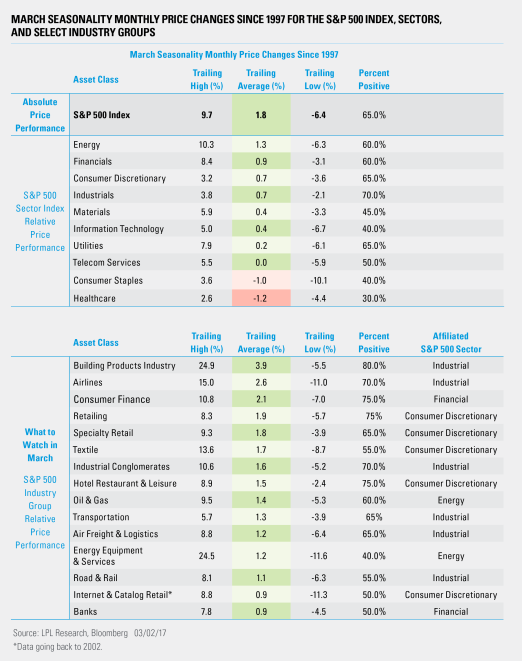
The S&P 500’s average price change for March has been 1.8%, with a best return of 9.7% and a worst return of -6.4% since 1997. Comparing the price performance of an underlying sector or industry group with the broad-based index over a specific period can help identify potentially strong seasonal performers. However, performance is often driven by factors other than seasonality. There is no guarantee that historically strong performing sectors will continue to be strong, and even those sectors that are seasonally strong on average will have underperforming years.
The sectors and industry groups that have outperformed the S&P 500 in March on average since 1997 are highlighted in green in the table below; those that underperformed the index are highlighted in red.
Let’s take a closer look at three areas of historical S&P 500 sector relative strength over the past 20 years.
Energy Sector Has Outperformed S&P 500 by Average of 1.3% Since 1997
The energy sector has outperformed the S&P 500 in March by an average of 1.3%, with a high return of 10.3% and a low return of -6.3%. Digging deeper, the S&P 500 oil and gas industry index has outperformed the S&P 500 by 1.4% in March on average, with a high of 9.5% and a low of -5.3%.
Financial Sector Has Outperformed Broad-Based Stocks by Average of 0.9% Since 1997
The financials sector has also tended to outperform broad-based stocks during this period. The S&P 500 financial sector has outperformed by an average of 0.9%, with a high of 8.4% and a low of -3.1% since 1997. The S&P 500 consumer finance industry group outperformed the equity benchmark by 2.1% on average, with a high of 10.8% and a low of -7%.
Consumer Discretionary Sector Has Outperformed Broad-Based Stocks by Average of 0.7% Since 1997
Consumer discretionary has outperformed the S&P 500 by 0.7% on average, with a high of 3.2% and a low of -3.6% since 1997. Notably, the S&P 500 retailing industry group outperformed the equity benchmark by 1.9% on average, with a high of 8.3% and a low of -5.7%.
Industrial Sector Has Outperformed Broad-Based Stocks by Average of 0.7% Since 1997
Last, but certainly not least, the industrial sector has outperformed the S&P 500 by 0.7% on average, with a high of 3.8% and a low of -2.1% since 1997. We note that the S&P 500 building products industry group outperformed the equity benchmark by 3.9% on average, with a high of 24.9% and a low of -5.5%. In addition, the S&P 500 airlines industry group on average outperformed the equity benchmark by 2.6%, with a high of 15% and a low of -11%.
As always, please stay tuned to the LPL Research blog for continued reviews of S&P 500 seasonal patterns and data in the months ahead.
*****
IMPORTANT DISCLOSURES
Past performance is no guarantee of future results. All indexes are unmanaged and cannot be invested into directly.
The opinions voiced in this material are for general information only and are not intended to provide or be construed as providing specific investment advice or recommendations for any individual security.
The economic forecasts set forth in the presentation may not develop as predicted.
Investing in stock includes numerous specific risks including: the fluctuation of dividend, loss of principal and potential illiquidity of the investment in a falling market.
Stock investing involves risk including loss of principal.
Because of their narrow focus, specialty sector investing, such as healthcare, financials, or energy, will be subject to greater volatility than investing more broadly across many sectors and companies.
The S&P 500 Index is a capitalization-weighted index of 500 stocks designed to measure performance of the broad domestic economy through changes in the aggregate market value of 500 stocks representing all major industries.
This research material has been prepared by LPL Financial LLC.
To the extent you are receiving investment advice from a separately registered independent investment advisor, please note that LPL Financial LLC is not an affiliate of and makes no representation with respect to such entity.
Not FDIC/NCUA Insured | Not Bank/Credit Union Guaranteed | May Lose Value | Not Guaranteed by any Government Agency | Not a Bank/Credit Union Deposit
Securities and Advisory services offered through LPL Financial LLC, a Registered Investment Advisor Member FINRA/SIPC
Tracking #1-587291 (Exp. 3/18)


