by Corey Hoffstein, Newfound Research
- Equity and bond valuations remain elevated.
- More importantly, joint valuation remains elevated in a 60/40 portfolio, forecasting low expected returns.
- Valuations are difficult to time. 60/40 portfolio valuations have been elevated for the past 5 years, a period over which a 60/40 portfolio returned nearly 50%. Sitting on the sidelines is likely not an option.
- We propose several strategies for investors looking to adapt their portfolio to this environment.
In May 2015, we wrote a commentary titled The 60/40 Forecast: 0% through 2025. Our thesis was simple: in an environment of high equity valuations and low bond yields, the math for a traditionally allocated balanced portfolio led to a long-term expected return of nearly 0% in real terms.
Since then, we’ve begun to hear the perspective a lot. That is not to say that we were the first to put the pieces together. Rather, it has become our personal Baader-Meinhof phenomenon: once we put together the outlook, we started seeing the outlook everywhere.
So much so, that last August we wrote a piece called Are Stocks Actually Undervalued? simply to address the contrarian argument. After all, in investing, when everyone agrees with you, it’s likely prudent to consider why you might be wrong.
The contrarian viewpoint really matters in two cases:
- Our thesis is wrong.
- The market has priced in the expectation already, and therefore the expectation is wrong.
The former case would largely imply that either (1) valuations no longer matter, or (2) interest rates are going to stay low for a really, really long time.
The latter case is a bit paradoxical, as to price in the expectation of lower returns, investors would have to sell the assets, driving down prices and increasing expected returns. The high valuations, in and of themselves, are then an indicator that the market is not actively pricing this expectation.
One simple explanation is that there is too much intertia for the market to do anything about it. Our anecdotal evidence suggests that the traditional 60/40 portfolio is the most popular allocation profile among advisor clients. Yet as we mentioned in our commentary J.P. Morgan Outlook Implies Satellite Bonds Are King, a “balanced” portfolio designed today that incorporates valuations would likely look meaningfully different with the incorporation of credit-based assets and alternative strategies.
Unwillingness to make a large change, a lack of process for making the change, or anxiety caused by tracking error to traditional assets may all be reasons why investors may stick with their traditional 60/40 portfolio.
This may create opportunity for investors willing to make tactical shifts.
How Do Valuations Look Today?
Compared to May 2015, things have gotten slightly worse.
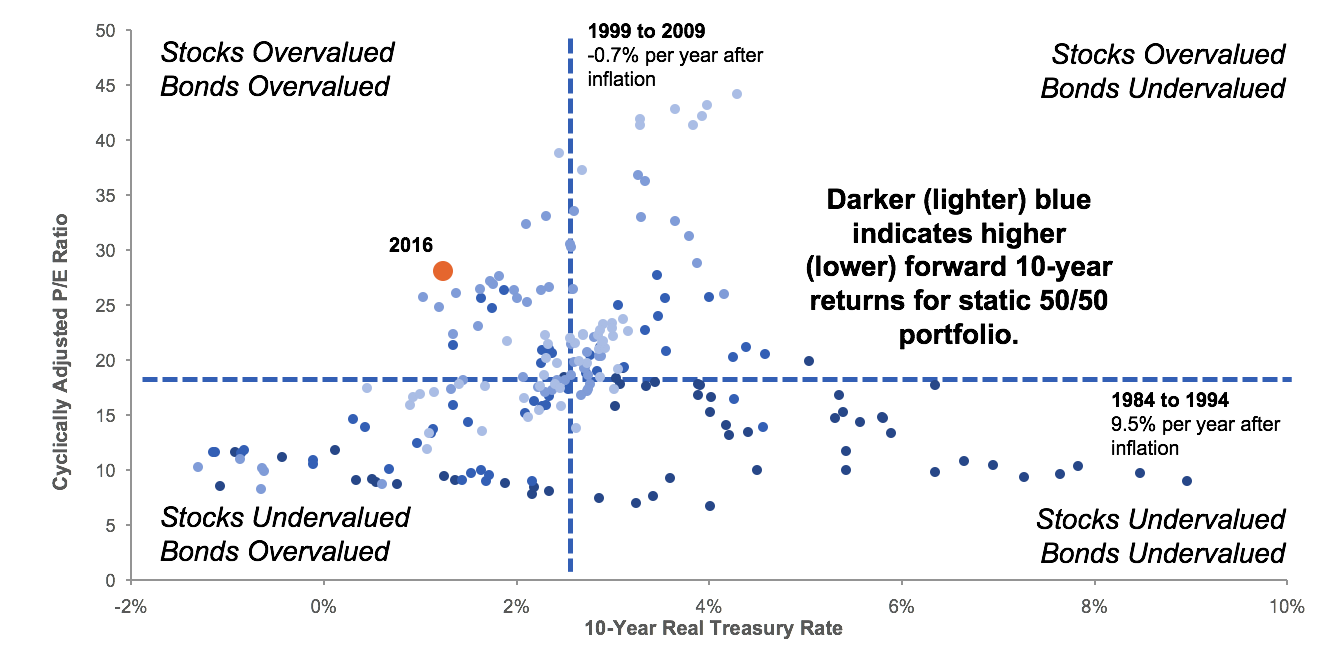
One of our favorite ways to look at valuations is by drawing a scatter plot of Cyclically Adjusted P/E (“CAPE”) ratios versus the 10-Year Real Treasury Rate.
The former measure allows us to capture U.S. equity valuations while the latter allows us to capture core fixed-income valuations.
 Data Source: Shiller data library (http://www.econ.yale.edu/~shiller/data.htm) and Federal Reserve of St. Louis. Calculations by Newfound Research. Data for the period from 1953 to 2016. Cyclically Adjusted P/E Ratio is a version of the P/E ratio that averages earnings over the prior ten years. The 50/50 portfolio is a hypothetical index. Index returns are hypothetical and do not reflect fees or transaction costs. Past performance does not guarantee future results.
What we can see is that 2016 sits squarely to the top left: a region where both stocks and bonds are overvalued against historical averages.
We like this graph because it provides a better portfolio perspective: stocks and bonds do not exist in a vacuum and it is important to remember that there is a relative valuation decision that needs to be made by investors.
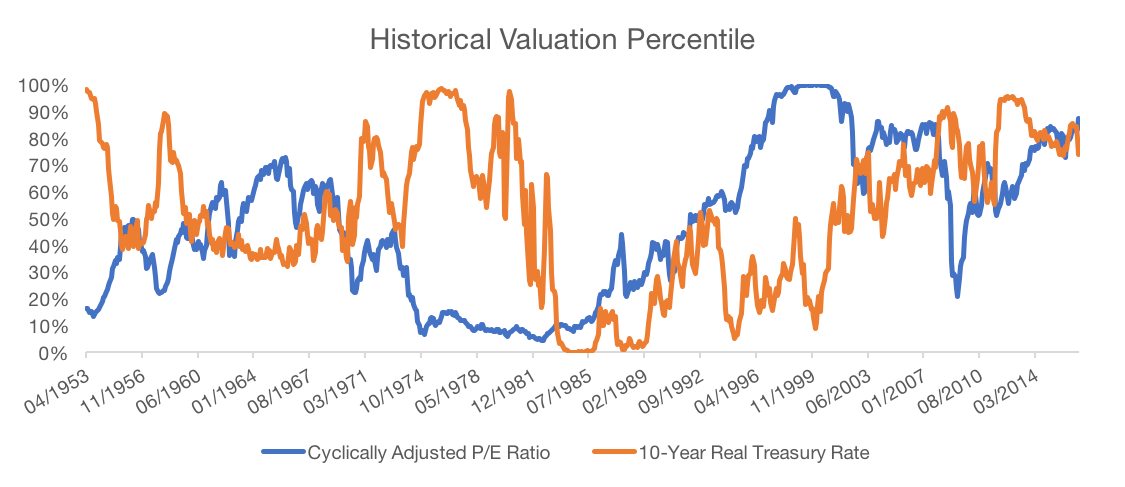
The only problem with it is that levels do not necessarily capture the extreme nature of certain readings. Below we plot the valuation metrics as a historical percentile.
Note: This plot has definitive look-ahead bias embedded, as it uses the full period of data to place historical readings into percentiles rather than using rolling periods. However, since our focus is on today’s valuations versus historical levels, we think the look-ahead bias is forgivable.
Data Source: Shiller data library (http://www.econ.yale.edu/~shiller/data.htm) and Federal Reserve of St. Louis. Calculations by Newfound Research. Data for the period from 1953 to 2016. Cyclically Adjusted P/E Ratio is a version of the P/E ratio that averages earnings over the prior ten years.
A few takeaways:
- From the early 1950s to the 1980s, stock and bond valuations appear to have a high degree of negative correlation.
- Valuations for both assets cratered in the early 1980s. Investors looking at returns of a passive, traditional portfolio over the past 35 years as a benchmark for expectations going forward should adjust for “multiple expansion,” or they may be sorely disappointed.
- Today, both equity and bond valuations sit above their 75th valuation percentile.
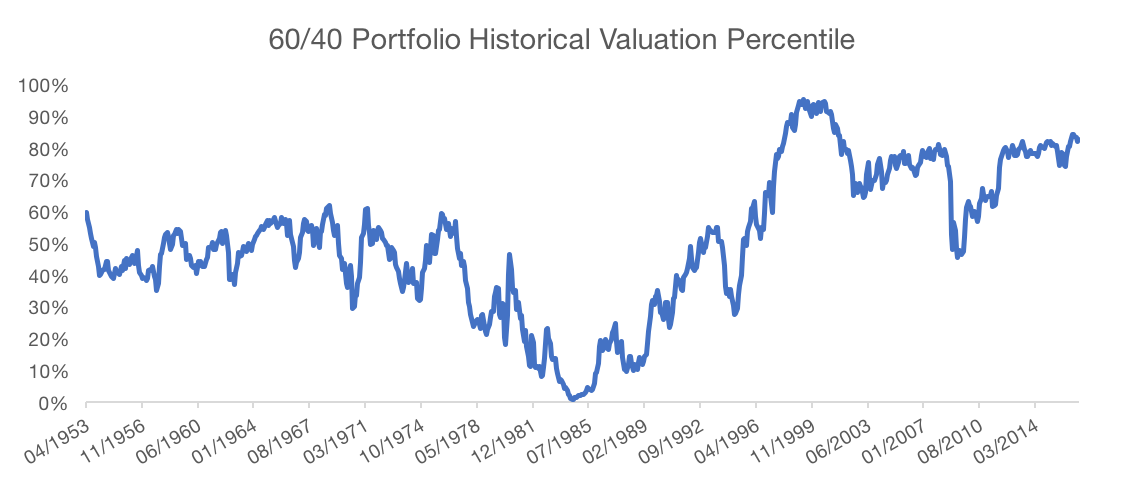
Even this picture does not tell the full story, however, as the valuation percentile of the 60/40 portfolio is not simply a 60/40 blend of the percentiles of the underlying assets.
Rather, we have to take into account their joint distribution, which gives us a slightly different picture.
Note: To do this, we simply turn CAPE and Real Yield values into z-scores, blend those z-scores in a 60/40 mix to create a portfolio z-score, and then use the normal CDF to transform the portfolio z-score into a percentile.
Data Source: Shiller data library (http://www.econ.yale.edu/~shiller/data.htm) and Federal Reserve of St. Louis. Calculations by Newfound Research. Data for the period from 1953 to 2016. Cyclically Adjusted P/E Ratio is a version of the P/E ratio that averages earnings over the prior ten years.
Our takeaways here are largely the same.
- From the 1950s through the 1970s, negative correlations kept total portfolio valuation fair while each asset drifted.
- Valuations cratered in the 1980s and it would have been a great time (with the benefit of hindsight) to buy a cheap, passive 60/40 portfolio.
What is slightly different:
- Equity valuations were so extreme in the dot-come bubble that despite real 10-year Treasury rates sitting below their 10th percentile in January 2000, the 60/40 portfolio sat in its 92nd
Today the 60/40 portfolio sits in its 82nd percentile.
Strategies for Dealing with Today’s Valuations
We think it is important to point out that while the 82nd percentile is high, valuations can get much more expensive before they get cheaper.
Also worth noting is that valuations have been hovering around the 82nd percentile since January 2012. Valuations are notoriously difficult to time, and if you had sat on the sidelines from January 2012 to January 2017, you would have missed the 49% total return a 60/40 portfolio would have generated.
Nevertheless, we think there are some prudent ideas worth considering:
- Keep Fees Low. In a low expected return environment, fees represent a greater proportion of total return, eating into the power of compounding.In our own model research portfolios, we advocate for a hybrid active/passive approach. We barbell low cost, passive indices with selective, higher cost, outcome-oriented approaches to help us keep total portfolio costs low.We do think it is important to note, however, that fees should be measured relative to value. A 0.2% fee may be too high for a closet indexer in a world where equity beta can be had for 0.05%. On the other hand, 0.6% may be perfectly reasonable for a highly concentrated, deep value portfolio
- Consider Alternative (Risk) Premia. In a low return environment, every little bit of (post-fee) alpha helps. The proliferation of smart beta ETFs now provides investors with the ability to implement systematic factor tilts into their portfolios at incredibly low costs.Creative use of these tilts may even allow you to rethink your entire portfolio design. Consider the Larry Portfolio – named after Larry Swedroe, Director of Research at the BAM Alliance – which is an alternative to a standard 60/40 that embeds value and size factor tilts.Larry argues that the portfolio is more diversified than a traditional 60/40 because it not only includes equity and fixed-income beta, but now includes two sources of diversifying alternative beta.Furthermore, because the value and size tilts increase expected return, the overall allocation to equities can go down. So the 60/40 equivalent Larry Portfolio is a 30% small value stock / 70% bond portfolio.
- Incorporate Non-Traditional Assets and Strategies. One of the great positive trends of the last 15 years has been the democratization in access of non-traditional assets and strategies. We think there are three categories worth considering:
- Credit Exposures. There are high-income exposures like high yield bonds, bank loans, EM debt, et cetera. These assets can not only introduce new, diversifying risk factors, but also offer competitive return expectations compared to traditional assets today.Investors can take a build it approach using the variety of ETFs available today, or look towards a Multi-Asset Income strategy for a turnkey solution.
- Trend-Following. Both academic and empirical evidence suggests that trend-following strategies can provide significant risk control against prolonged drawdowns.In an environment of high valuations for both stocks and bonds, bonds may not provide the same crisis alpha they historically have (see our commentary Bond Returns: Don’t Be Jealous, Be Worried), and diversifying how we look to manage risk in the portfolio may be prudent.A more diversified approach to equity trend-following can also be implemented using managed futures strategies.
- True Alternatives. While most asset classes exhibit significant correlation to either stocks or bonds – particularly during negative market shots – market neutral strategies can allow investors to incorporate truly diversying risk premia. While leverage constraints make these solutions low volatility, there are many options now available for consideration in the mutual fund or ETF space.
Conclusion
In 2017, traditional asset class valuations are no cheaper than they were in 2015. Despite trying to convince ourselves of the contrarian case for why this time is different, we believe it is simply more likely that average returns will be depressed over the next decade.
Nevertheless, a positive real return is better than no return, and with valuations being notoriously difficult to time, sitting on the sidelines may not be a prudent conclusion. After all, joint stock-bond valuations have been elevated for the past 5 years, and over that period a 60/40 portfolio returned nearly 50%.
Given this outlook, we think there are many strategies investors can employ to try to tilt the odds in their favor. While none of these approaches are a silver bullet, we believe that in combination they have the ability to not only increase expectations for results at the destination, but also help increase the quality of the journey along the way.
Client Talking Points
- Valuations for stocks and bonds are important to track because they help us establish expectations for performance over the next 7-10 years.
- We likely need to lower our expectations for portfolio returns until valuations normalize.
- We can try to adapt to this environment by going beyond a traditional portfolio and incorporating many new asset classes and approaches that were largely unavailable to investors just a decade ago.
Copyright © Newfound Research


