by LPL Research
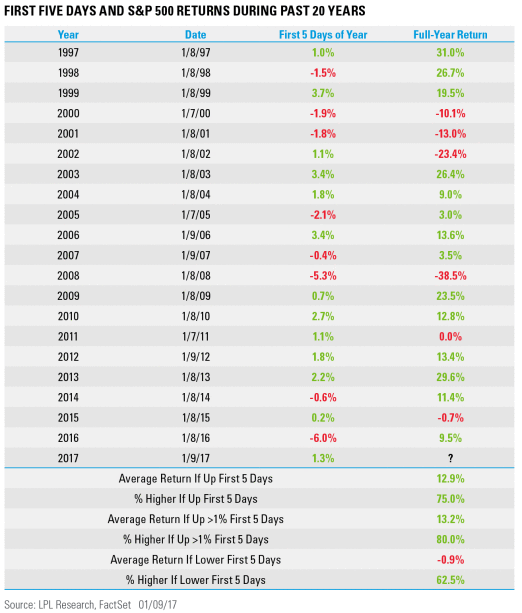
The first five days of 2017 are in the books, and the S&P was up 1.3%, the best start to a year since 2013. This is a far cry from the 6% drop last year, which was actually the worst start to the year ever.
This time of year we hear a lot about how the first five days of the year can accurately predict the full year. After all, a big start in 2013 signaled a big move that year, while a big dip to start 2008 was a warning of more trouble to come. Then again, after the worst start to a year ever last year, the S&P rebounded to close the year up 9.5%—so this sure isn’t foolproof.
Going back 20 years, when the S&P 500 was higher in the first five days, the full year was up 12.9%, whereas when those first five days were in the red, the full year was actually down nearly 1% on average.
Taking things back to 1950,* the results have been even more impressive. Per Ryan Detrick, Senior Market Strategist, “Although the first five days of the year as an indicator for the full year might sound rather random, there appears to be some truth to it. When those first five days were higher, then the full year was up nearly 14% on average versus when those days were lower, the return was only 1.0%. The real eye-opening stat is when those first five days were up more than 1% (like this year), then the full year finished higher more than 88% of the time.”
There have been 26 times when the S&P 500 was up at least 1% in the first five days of the year and only three times did the full year close lower. Two of those times were 1973 and 2002, both years that saw recessions, while 2011 was the other year and the S&P 500 was only fractionally lower on the year then. As we discussed in Outlook 2017: Gauging Market Milestones, the odds of a recession in 2017 are rather low, which helps support the chances that the S&P 500 finishes higher this year; this study only further supports that outlook.
*Please note: The modern design of the S&P 500 stock index was first launched in 1957. Performance back to 1950 incorporates the performance of predecessor index, the S&P 90.
IMPORTANT DISCLOSURES
Past performance is no guarantee of future results.
The opinions voiced in this material are for general information only and are not intended to provide or be construed as providing specific investment advice or recommendations for any individual security.
The economic forecasts set forth in the presentation may not develop as predicted.
Investing in stock includes numerous specific risks including: the fluctuation of dividend, loss of principal and potential illiquidity of the investment in a falling market.
There is no guarantee that a diversified portfolio will enhance overall returns or outperform a nondiversified portfolio. Diversification does not ensure against market risk.
The Standard & Poor’s 500 Index is a capitalization-weighted index of 500 stocks designed to measure performance of the broad domestic economy through changes in the aggregate market value of 500 stocks representing all major industries.
This research material has been prepared by LPL Financial LLC.
To the extent you are receiving investment advice from a separately registered independent investment advisor, please note that LPL Financial LLC is not an affiliate of and makes no representation with respect to such entity.
Not FDIC/NCUA Insured | Not Bank/Credit Union Guaranteed | May Lose Value | Not Guaranteed by any Government Agency | Not a Bank/Credit Union Deposit
Securities and Advisory services offered through LPL Financial LLC, a Registered Investment Advisor Member FINRA/SIPC
Tracking #1-570677 (Exp. 1/18)
Copyright © LPL Research


