by LPL Research
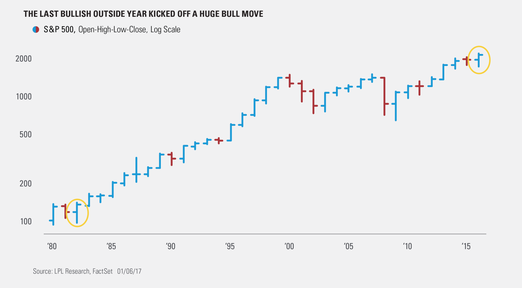
Something happened last year that has only happened twice in the history of the S&P 500, and it could be a very bullish development, as 2016 completed what is called a bullish outside year. An outside year occurs when the high of the year is above the high from the previous year and the low from that year is beneath the low from the previous year. During the big drop the S&P 500 took at the start of 2016, it broke the low from August 2015; then in July when the S&P 500 broke out to new highs, it moved above the high from May 2015. Outside days, weeks, and months are fairly common and considered to be bullish technical developments when the pattern completes above the previous high, but a bullish outside year has only happened two other times—in 1935 and 1982.
According to Ryan Detrick, Senior Market Strategist, “We started talking about the potential for a bullish outside year back in July, when the S&P 500 broke out to new highs. Now that the year is officially over, this is only the third bullish outside year ever. The two previous outside years, in 1935 and 1982, saw gains of 27.9% and 17.2% the following year, respectively. Of course, if you want to find a flaw with this, it is that the sample size is only two, so it could be totally random. But in the end, we’d still side with this development supporting the bull market turning eight this year and finishing the year higher.”
We all know that 1982 kicked off a huge 18-year bull market, while the other bullish outside year in 1935 saw a nice gain of 27.9% in 1936, but it all came crashing down with a 38.6% drop in 1937, as the Great Depression continued.
Here’s something else to consider that could be a good sign for this bullish outside year. The S&P 500 closed at a monthly all-time high at the end of December 2016, exactly like it did in 1982. December 1935 didn’t close at new monthly high, so 2016 and 1982 are the only times in history the S&P 500 made a bullish outside year and saw the S&P 500 close at a monthly new high.
In conclusion, as we discussed in Outlook 2017: Gauging Market Milestones, earnings growth and an accelerating economy should produce mid-single-digit equity returns, even though valuations are somewhat historically stretched. The bullish outside year we saw in 2016 further reinforces the odds this bull market continues in 2017.
IMPORTANT DISCLOSURES
The opinions voiced in this material are for general information only and are not intended to provide or be construed as providing specific investment advice or recommendations for any individual security.
The economic forecasts set forth in the presentation may not develop as predicted.
Investing in stock includes numerous specific risks including: the fluctuation of dividend, loss of principal and potential illiquidity of the investment in a falling market.
Because of their narrow focus, specialty sector investing, such as healthcare, financials, or energy, will be subject to greater volatility than investing more broadly across many sectors and companies.
We expect mid-single-digit returns for the S&P 500 in 2017 consistent with historical mid-to-late economic cycle performance. We expect S&P 500 gains to be driven by: 1) a pickup in U.S. economic growth partially due to fiscal stimulus; 2) mid- to high-single-digit earnings gains as corporate America emerges from its year-long earnings recession; 3) an expansion in bank lending; and 4) a stable price-to-earnings ratio (PE) of 18 – 19.
Indices are unmanaged and cannot be invested into directly. Unmanaged index returns do not reflect fees, expenses, or sales charges. Index performance is not indicative of the performance of any investment. Past performance is no guarantee of future results.
The Standard & Poor’s 500 Index is a capitalization-weighted index of 500 stocks designed to measure performance of the broad domestic economy through changes in the aggregate market value of 500 stocks representing all major industries.
This research material has been prepared by LPL Financial LLC.
To the extent you are receiving investment advice from a separately registered independent investment advisor, please note that LPL Financial LLC is not an affiliate of and makes no representation with respect to such entity.
Not FDIC/NCUA Insured | Not Bank/Credit Union Guaranteed | May Lose Value | Not Guaranteed by any Government Agency | Not a Bank/Credit Union Deposit
Securities and Advisory services offered through LPL Financial LLC, a Registered Investment Advisor Member FINRA/SIPC
Tracking #1-570089 (Exp. 1/18)
Copyright © LPL Research


