For years I've been saying that the Fed can't control bond yields, but the myth that the Fed can manipulate yields (e.g., by buying lots of 10-yr Treasuries and/or by buying lots of MBS) persists. Experience tells us that the Fed can only control short-term rates, and even then it is questionable whether the Fed can move rates up or down by more than the market is ready for at any given time. Recall the bond market tantrum earlier this year when the Fed hinted that it might raise rates several times during the course of the year, and the Fed then quickly backed off, raising rates only once (recently). Bond yields are effectively set by market forces, and are heavily influenced by the market's perception of the future of Fed policy, the expected level of inflation, and the outlook for economic growth.
Here are some charts which compare the history of the Fed's purchases of Treasuries and MBS and their corresponding yields. You can judge for yourself whether the Fed has managed to manipulate those yields with its Quantitative Easing programs.
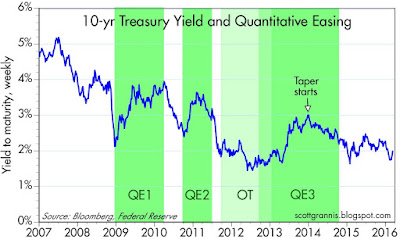
The chart above shows what happened to 10-yr Treasury yields during the Fed's three Quantitative Easing programs. In each period, despite massive bond purchases, the yield on 10-yr Treasuries rose. Ironically, the Fed justified QE by saying it would depress yields, and that in turn would stimulate the economy. What I think really happened to cause yields to rise despite Fed bond purchases was that the Fed's QE efforts supplied badly-needed bank reserves to the system, and that satisfied the market's thirst for safe assets; that in turn resulted in healthier market liquidity, which in turn caused the market to become somewhat more optimistic about future growth, which in turn caused the market to anticipate higher short-term interest rate guidance from the Fed in the future.
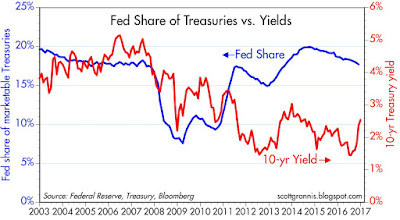
The chart above compares the magnitude of the Fed's Treasury purchases with the level of 10-yr yields. It stands to reason that the Fed could potentially manipulate the bond market only if it buys or sells a quantity of bonds that is significant relative to the outstanding supply of those bonds. Thus the rationale for the blue line, which is the ratio of the Fed's holdings of Treasuries relative to the total marketable supply of Treasuries. Several things jump out: 1) during 2008, as Fed holdings of Treasuries were plunging, yields were falling, and 2) in 2013, as Fed holdings of Treasuries was surging as part of QE3, Treasury yields surged (both in contrast to what the Fed promised QE would do), and 3) the Fed currently holds about 18% of outstanding Treasury debt, and that is about the same amount it held at the end of 2004 and less than the 20% of Treasury debt it held at the end of 2002, yet yields today are much lower than they were back then. Tough to see any convincing or enduring correlation between these lines.
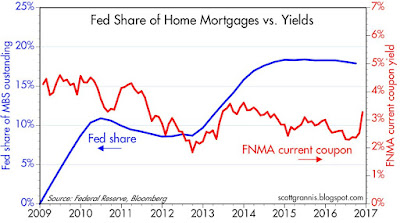
The chart above compares the magnitude of the Fed's MBS purchases with the level of MBS yields. Here we see that despite huge MBS purchases in 2009, MBS yields were relatively unchanged. More recently, with Fed holdings of MBS holding relatively steady, yields have surged. No convincing causality or correlation that I can see between these two lines.
The recent surge in bond yields has almost nothing to do with Fed policy, and very little to do with increased inflation expectations. It's mostly about an improving outlook for growth assuming that Trump is able to reduce the tax and regulatory burdens that have been holding back growth for the past decade.
photo credit: Floyd Yarmuth, CNN
Copyright © Scott Grannis


