by LPL Research
The rally since the U.S. election continues, as the Dow has now closed at a new all-time high for six consecutive days. As we noted at the start of the month, December historically is a strong month for equities regardless of the scenario coming into the month, and so far that has played out nicely this year.
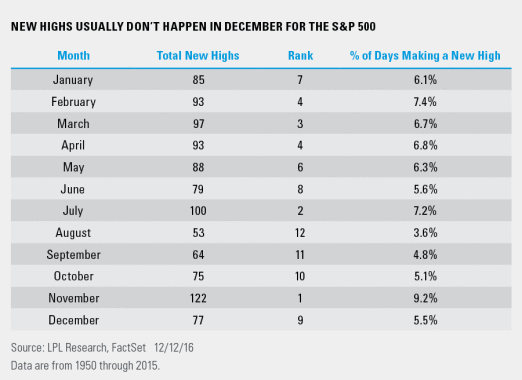
With all the new highs happening over the past month, this brings about the question: when do most new highs tend to happen? Per Ryan Detrick, Senior Market Strategist, “Going back to 1950* on the S&P 500, it turns out the historically strong month of December hasn’t seen as many new all-time highs as you’d think. In fact, it has only had 77 new highs and ranks ninth out of 12 months. On the other side of the spectrum, no month has seen more new highs than November.”
Taking a closer look at December, it isn’t surprising, but the S&P 500 has never been lower on the year when it made a new all-time high in the last month of the year. In fact, since 1950, the S&P 500 has made a new all-time high in December during 16 other years besides this year, and the average yearly return has been 23%. With the current year-to-date return in 2016 about half of that, this year has been below average. Does a new all-time high in December tell us much about the following year? It doesn’t look like it means much if you are bullish, as the year after a new high is made in December has been up 7.0% on average, versus the average year since 1950 up 8.9%—so it has been a little weaker.
*****
IMPORTANT DISCLOSURES
Past performance is no guarantee of future results. All indexes are unmanaged and cannot be invested into directly.
The opinions voiced in this material are for general information only and are not intended to provide or be construed as providing specific investment advice or recommendations for any individual security.
The economic forecasts set forth in the presentation may not develop as predicted.
Investing in stock includes numerous specific risks including: the fluctuation of dividend, loss of principal and potential illiquidity of the investment in a falling market.
*Please note: The modern design of the S&P 500 stock index was first launched in 1957. Performance back to 1950 incorporates the performance of predecessor index, the S&P 90.
The S&P 500 Index is a capitalization-weighted index of 500 stocks designed to measure performance of the broad domestic economy through changes in the aggregate market value of 500 stocks representing all major industries.
The Dow Jones Industrial Average (DJIA) Index is comprised of U.S.-listed stocks of companies that produce other (nontransportation and nonutility) goods and services. The Dow Jones Industrial Averages are maintained by editors of The Wall Street Journal. While the stock selection process is somewhat subjective, a stock typically is added only if the company has an excellent reputation, demonstrates sustained growth, is of interest to a large number of investors, and accurately represents the market sectors covered by the average. The Dow Jones averages are unique in that they are price weighted; therefore, their component weightings are affected only by changes in the stocks’ prices.
This research material has been prepared by LPL Financial LLC.
To the extent you are receiving investment advice from a separately registered independent investment advisor, please note that LPL Financial LLC is not an affiliate of and makes no representation with respect to such entity.
Not FDIC/NCUA Insured | Not Bank/Credit Union Guaranteed | May Lose Value | Not Guaranteed by any Government Agency | Not a Bank/Credit Union Deposit
Securities and Advisory services offered through LPL Financial LLC, a Registered Investment Advisor Member FINRA/SIPC
Tracking # 1-563502 (Exp. 12/17)


