by LPL Research
The market action since the election has been historic in many ways. We noted many of the rare occurrences in a blog post here. Something new happened on Monday that has never happened before. More than 300 issues on the New York Stock Exchange (NYSE) made new 52-week highs, while more than 300 issues also made new 52-week lows. Think about that: many things are making new highs, while many are also making new lows—that is a confused market!
Taking a deeper look, on Monday, 353 issues on the NYSE made a new 52-week high, the most in more than three months. At the same time, 330 issues made a new 52-week low, the most since February 11. As you might recall, that date was also the calendar year low for the S&P 500.
What could this wide dispersion mean? Without getting into all the details, there is a popular bearish technical pattern that is used to forecast potential stock market crashes called the Hindenburg Omen (after the Hindenburg disaster in 1937). One of the criteria for this omen to trigger is a surge in both new highs and new lows—exactly what we just saw. The thinking is this suggests a market that is very unsure of itself.
So should we get ready for the next major market crash? To quote the great Lee Corso, “Not so fast my friends.” The NYSE data are skewed significantly by debt-like instruments. You see, bonds had one of their worst weeks ever last week (according to the Barclays US Aggregate Bond Index), so anything that is linked to fixed income also had a very rough week, with many debt instruments making new lows along the way. Looking at common stocks only shows a much different backdrop, as on Monday common stocks made 319 new highs, with only 21 new lows.
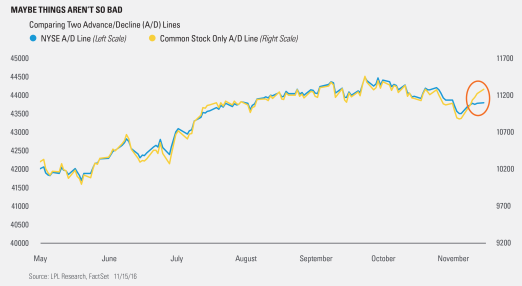
Here’s another way to show this using advance/decline lines. An advance/decline line is simply a daily cumulative tally of how many stocks were up or down each day on an exchange. A higher trending advance/decline line suggests a technically sound market. As you can see here, historically the common stock only and NYSE A/D lines have traded very closely, but since the election the common stock only has done much better than the NYSE A/D line, suggesting equity markets could be on a much firmer footing than some think. As Ryan Detrick, Senior Market Strategist, put it, “The theory behind the Hindenburg Omen of many stocks making new highs and lows at the same time has a decent track record and isn’t something to ignore. However, the reality is the historically weak bond market may be skewing market internals right now. Equities continue to be on very firm footing here.”
******
IMPORTANT DISCLOSURES
Past performance is no guarantee of future results. All indexes are unmanaged and cannot be invested into directly. Unmanaged index returns do not reflect fees, expenses, or sales charges. Index performance is not indicative of the performance of any investment.
The economic forecasts set forth in the presentation may not develop as predicted.
The opinions voiced in this material are for general information only and are not intended to provide or be construed as providing specific investment advice or recommendations for any individual security.
Stock investing involves risk including loss of principal.
Bonds are subject to market and interest rate risk if sold prior to maturity. Bond and bond mutual fund values and yields will decline as interest rates rise and bonds are subject to availability and change in price.
Because of its narrow focus, specialty sector investing will be subject to greater volatility than investing more broadly across many sectors and companies.
Technical Analysis is a methodology for evaluating securities based on statistics generated by market activity, such as past prices, volume and momentum, and is not intended to be used as the sole mechanism for trading decisions. Technical analysts do not attempt to measure a security’s intrinsic value, but instead use charts and other tools to identify patterns and trends. Technical analysis carries inherent risk, chief amongst which is that past performance is not indicative of future results. Technical Analysis should be used in conjunction with Fundamental Analysis within the decision making process and shall include but not be limited to the following considerations: investment thesis, suitability, expected time horizon, and operational factors, such as trading costs.
The S&P 500 Index is a capitalization-weighted index of 500 stocks designed to measure performance of the broad domestic economy through changes in the aggregate market value of 500 stocks representing all major industries.
This research material has been prepared by LPL Financial LLC.
To the extent you are receiving investment advice from a separately registered independent investment advisor, please note that LPL Financial LLC is not an affiliate of and makes no representation with respect to such entity.
Not FDIC/NCUA Insured | Not Bank/Credit Union Guaranteed | May Lose Value | Not Guaranteed by any Government Agency | Not a Bank/Credit Union Deposit
Securities and Advisory services offered through LPL Financial LLC, a Registered Investment Advisor
Member FINRA/SIPC
Tracking #1-556114 (Exp. 011/17)


