by LPL Research
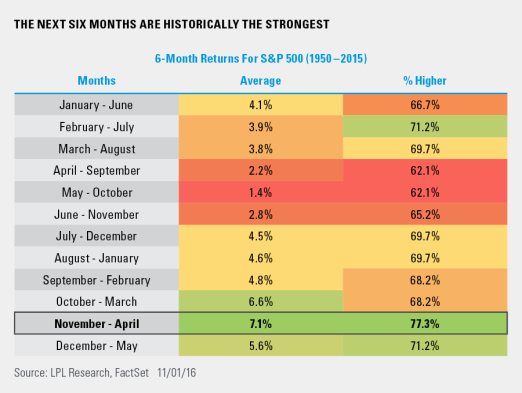
As the old trading axiom goes, selling in May and waiting six months to buy is a time-proven strategy. The good news about that is the November-to-April time frame is the strongest six months historically for equities. According to Ryan Detrick, Senior Market Strategist, “The strongest six months of the year are upon us. After a historically tight range the past three months, coupled with an improving earnings outlook and strengthening economy, it could be seasonality that helps the S&P 500 break out to the upside of its range.”
As this chart shows, going back to 1950,* the November-to-April time frame is indeed the best of all six month combinations (up 7.4% on average), while the May-to-October period is the worst, (up only 1.4% on average). In other words, nearly all of the gains tend to happen during the next six months.
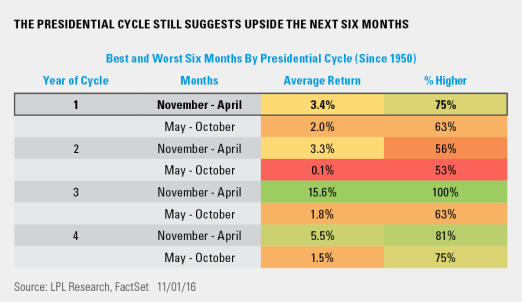
What about the November-to-April time frame based on the Presidential Cycle? Going back to 1950, during the first year of the presidential cycle (November of an election year to April following the inauguration) those six months have averaged +3.4% and been higher 75% of the time. Looking at recent history though, these six months were down 9.9% from November 2008 to April 2009 and down 12.6% from November 2000 to April 2001. In other words, more recent Presidential cycles haven’t been too kind. Of course, both of those times were recessions and the economy is on fairly firm footing currently – one big difference as we head into 2017.
Lastly, what does it mean (if anything) when stocks climb higher during the historically weak May-to-October period during an election year? Remember, the S&P 500 has actually gained 2.9% over the last six months. Turns out, a gain between May and October in an election year (like we just saw in 2016) is a very good sign. Going back to 1980, the following six month period (November to April) has been higher seven out of seven times with an average return of +8.2%.
*Any data prior to March 4, 1957 is back-tested, as published by the index’s parent company, S&P DOW Jones Indices. All information for an index prior to its Launch Date is back-tested, based on the methodology that was in effect on the Launch Date. Back-tested performance, which is hypothetical and not actual performance, is subject to inherent limitations because it reflects application of an Index methodology and selection of index constituents in hindsight. No theoretical approach can take into account all of the factors in the markets in general and the impact of decisions that might have been made during the actual operation of an index. Actual returns may differ from, and be lower than, back-tested returns.
***
IMPORTANT DISCLOSURES
Past performance is no guarantee of future results.
The economic forecasts set forth in the presentation may not develop as predicted.
The opinions voiced in this material are for general information only and are not intended to provide or be construed as providing specific investment advice or recommendations for any individual security.
Investing in stock includes numerous specific risks including: the fluctuation of dividend, loss of principal and potential illiquidity of the investment in a falling market.
The S&P 500 Index is a capitalization-weighted index of 500 stocks designed to measure performance of the broad domestic economy through changes in the aggregate market value of 500 stocks representing all major industries.
Indices are unmanaged index and cannot be invested into directly. Unmanaged index returns do not reflect fees, expenses, or sales charges. Index performance is not indicative of the performance of any investment.
This research material has been prepared by LPL Financial LLC.
To the extent you are receiving investment advice from a separately registered independent investment advisor, please note that LPL Financial LLC is not an affiliate of and makes no representation with respect to such entity.
Not FDIC/NCUA Insured | Not Bank/Credit Union Guaranteed | May Lose Value | Not Guaranteed by any Government Agency | Not a Bank/Credit Union Deposit
Securities and Advisory services offered through LPL Financial LLC, a Registered Investment Advisor Member FINRA/SIPC
Tracking # 1-551660 (Exp. 10/17)
Copyright © LPL Research


