by Jeffrey Saut, Chief Investment Strategist, Raymond James
Many shrewd investors who were nervous about overvalued shares had lost out before by selling too early and were coming back into the market. They faced the classic dilemma of the rational man caught in an irrational frenzy, which had been so evident in the South Sea Bubble of 1720: as the banker John Biddulph Martin had said, ‘When the rest of the world are mad, we must imitate them in some measure.’ At an early stage of the bubble the great mathematician Isaac Newton had realized how irrational it was and sold his shares in the South Sea Company at a profit of seven thousand pounds. But even Newton could not resist the next stage of speculative frenzy and bought more shares eventually losing twenty thousand pounds in the crash. And the hysteria was summed up by the poet Alexander Pope:
‘All this Madness,’ cries a sober sage:
But who, my friend, has reason in his rage?
‘The Ruling Passion; be it what it will,
The Ruling Passion conquers reason still.’
. . . “The Midas Touch,” by Anthony Sampson
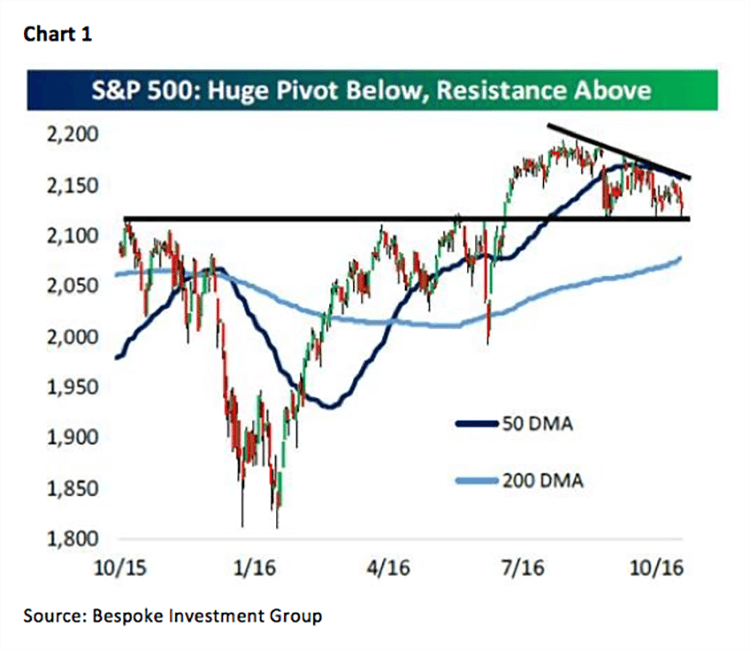
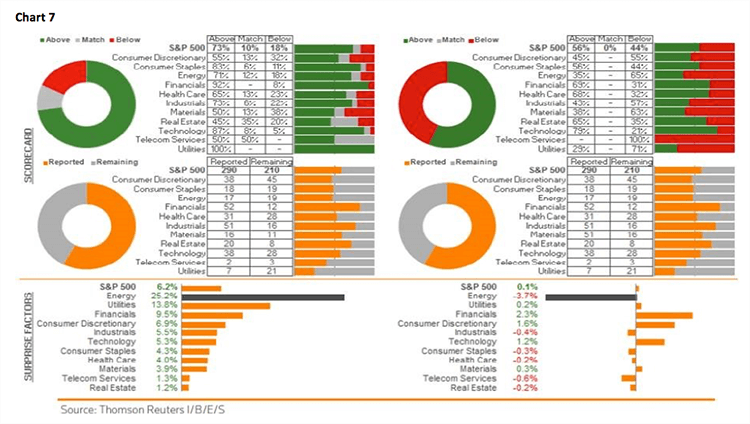
I recalled this quip from “The Midas Touch” while studying an unbelievable chart crafted by Kieron Nutbrown titled, “500 Years of Stock Panics-Bubbles-Manias-Meltdowns” that can be seen by clicking here. It shows, in a composite index, stock prices since the year 1509. Speaking of good years in the various markets, mid-February to mid-August of 2016 was a good year for the S&P 500! Almost 400 S&P 500 points from bottom to top for a percentage gain of ~21%. At that rate the S&P 500 (SPX/2126.41) will be over 3000 a year from now. Our models actually called that mid-February “low,” as well as turning cautious in late August targeting the mid-to-late September timeframe as a window of downside vulnerability, but looked for only a small decline (3% - 6%). Almost on cue, since mid-August that only-on-Wall Street enthusiasm has been tempered as the SPX tested the 2100 – 2120 support level twice on investors’ fears of slowing economic statistics and waning corporate earnings reports. Yet Andrew Adams and I have “kept the faith and still believed” the earnings profit trough occurred in 2Q16 and that the U.S. GDP was set to rebound. It is kind of like when George Michael and Aretha Franklin sang, “I found my way out of the darkness, kept my faith, kept my faith (I Still Believe). Sure enough, as of last Friday morning of the 290 companies in the S&P 500 that had reported earnings 73% beat the estimate, 10% matched the estimate, and 18% were below. So much for the negative nabobs that told us 3Q16 earnings would be terrible.
Turning to Friday’s better than expected GDP report, our economist, Scott Brown Ph.D. writes:
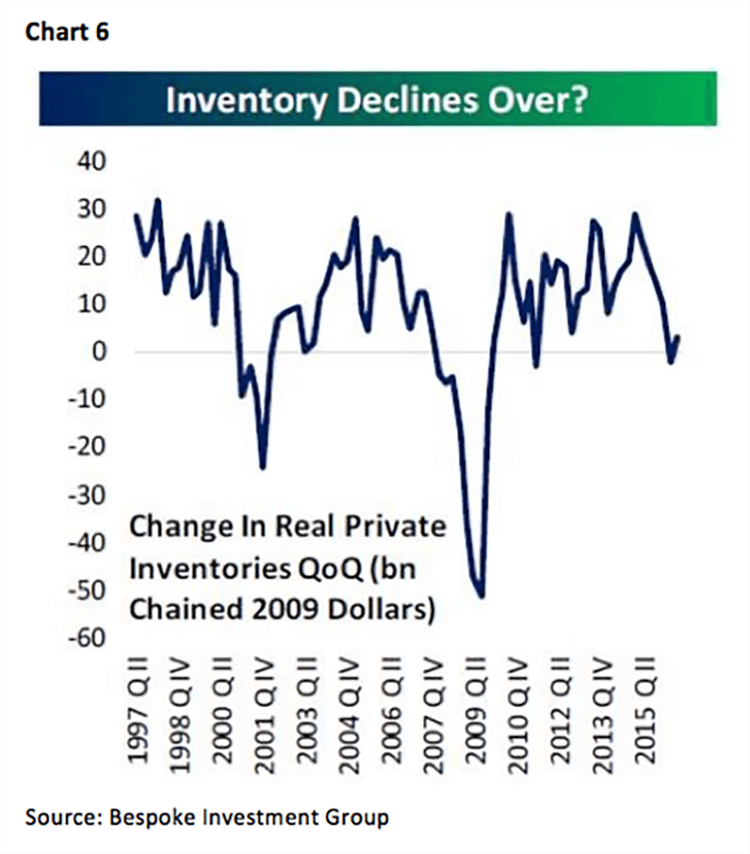
Bottom Line: A slight positive for stocks and the dollar, a slight negative for the bond market. The headline figure was a little on the high side of expectations, although third quarter growth was not as strong as the figure would seem to imply (just as GDP figures for the previous four quarters were not as weak as they appeared). Consumer spending rose moderately. Business fixed investment was mixed (equipment lower, structures and intellectual property products higher). Residential homebuilding was a slight drag. Inventories stopped falling and turned higher, adding 0.6 percentage point to the headline figure. A narrower trade deficit (an increase in net exports) added 0.8 ppt. Private Domestic Final Purchases (consumer spending, business investment, residential fixed investment) rose at a 1.6% pace (lackluster, but not horrible). While these figures will be revised, the story was largely as expected and should not change much. The Employment Cost Index was as expected, keeping the Fed on track for tightening, but not forcing the Fed’s hand in the near term. Note that the GDP figure should not be a factor in the Fed’s policy decisions (the focus is on the job market and the inflation outlook).
So what does all this mean for the equity markets? Well if indeed the markets are forward looking, it means they are sensing GDP is going to improve at the margin and that the secular bull market is transitioning from an interest-driven bull market to an earnings-driven bull market. Speaking to last Friday’s action, talk about an October surprise as Weinergate revelations roiled the markets, taking 22 points off the SPX in about one hour. The Spoos Slide took the SPX back into its 2100 – 2120 support zone for the third time, causing my phone to light up. The ubiquitous question was, “Is this the third ‘test’ into that support level you have been looking for?” My response was “well maybe – but Never on a Friday,” meaning markets rarely bottomed on a Friday. So let’s examine the weight of the evidence.
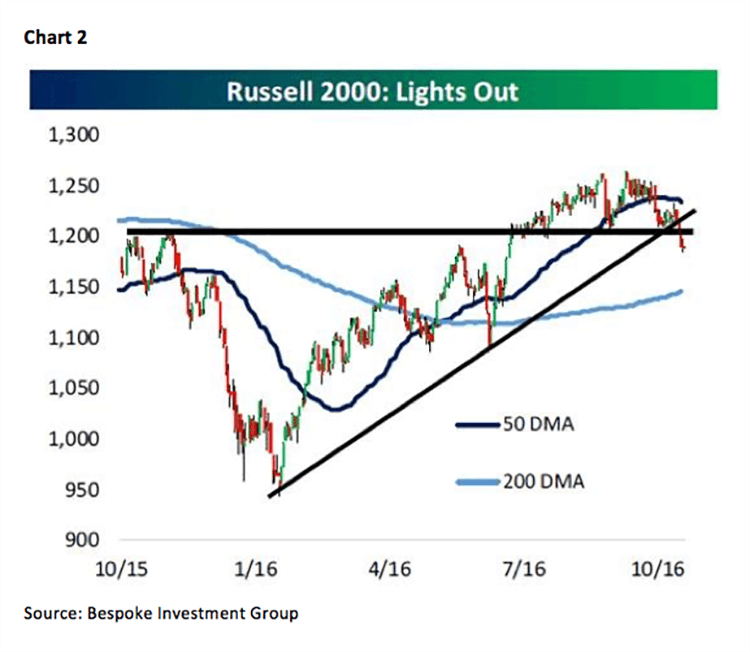
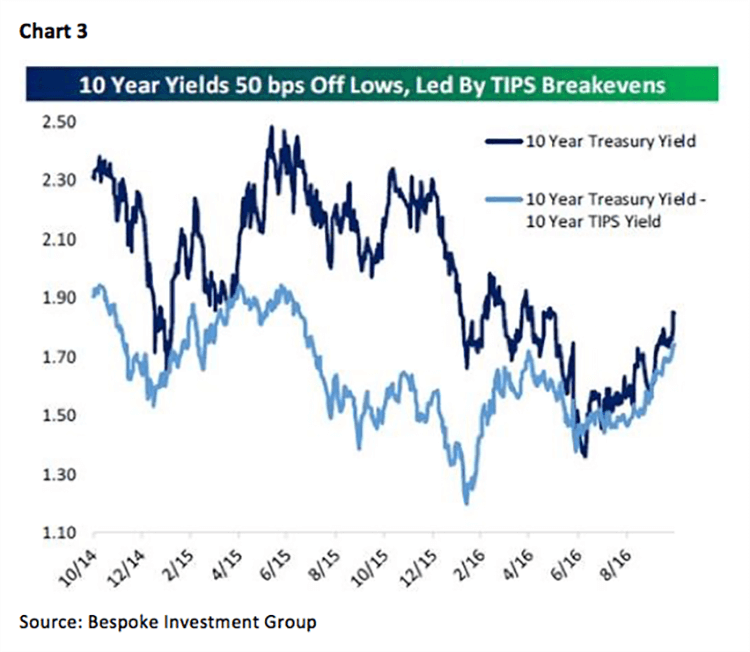
The SPX remains at a key pivot point. The 2100 – 2120 support level is critical (see chart 1 on page 3). A downside violation of that level would suggest something more than our anticipated 3% - 6% pullback. Worrisome is that the Russell 2000 has already broken down in the charts (chart 2) and that the NASDAQ New High/New Low Ratio is below 50% (more stocks at one-year lows than one-year highs). Interest rates have risen (headwind, chart 3 on page 4), as has the U.S. Dollar Index (headwind, chart 4). On the more positive side the McClellan Oscillator is very oversold, a fact that is confirmed by the number of S&P 500 stocks trading below their respective 50-day moving averages (chart 5 on page 5). Meanwhile, our proprietary model is as oversold as it ever gets. As stated, the economic numbers should get better from here (the inventory decline looks to be over, chart 6), along with improving corporate earnings (chart 7 on page 6). Accordingly, this week shapes up as an important week in terms of time and price.
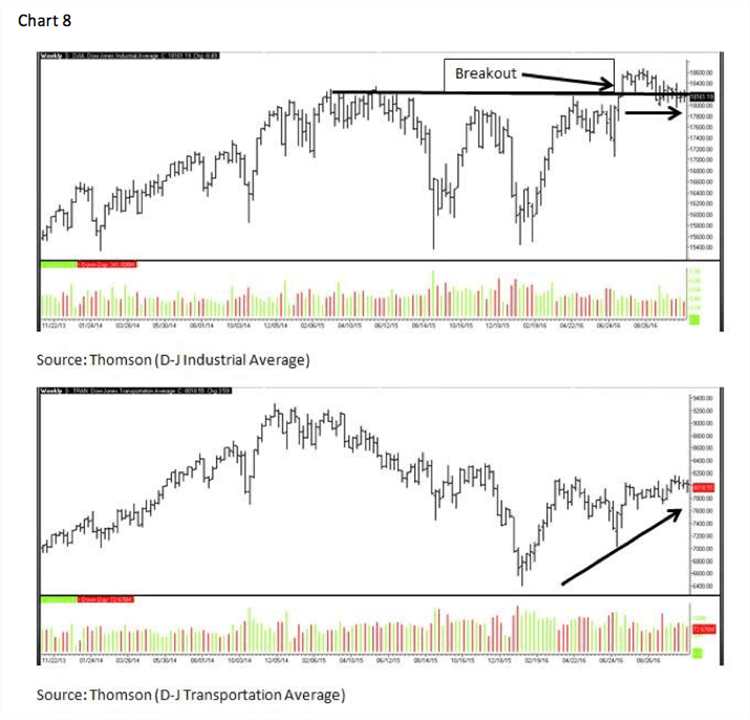
The call for this week: Last Friday we entered the strongest five days of the year and the proverbial bullish carrot in front of the horse could be this week’s FOMC meeting, Employment Report, and the ISM Manufacturing numbers. In point of fact, tomorrow we enter the strongest six months of the year! For this week, however, we expect the FOMC to be a non-event and for nonfarm payrolls to edge higher. Speaking of “higher,” while our models are calling for higher stock prices, so is the D-J Transportation Average (TRAN/8018.55). To be sure, after the D-J Industrial Average (INDU/18161.19) broke out to the upside from its 19-month trading range in July of this year, the Dow tagged a new all-time intraday high of ~18668. Since then the Industrials have basically gone sideways within the construct of a higher trading range. Not so the Transports. Hopefully the economically sensitive Trannies are pointing the way higher for the overall stock market (chart 8 on page 7).
P.S. “To speak out against the madness may be to ruin those who have succumbed to it. So the wise on Wall Street nearly always remain silent. The foolish have the field to themselves, and none rebukes them.” (J.K. Galbraith).
Copyright © Raymond James


