Inside the Numbers: Utility Stocks Are Trading Like Long Bonds
by Bob Simpson, Synchronicity Performance Consultants
September 16, 2016
We have experienced a significant move in utility stocks over the past year as Baby Boomer investors chase yield.
Let's go Inside The Numbers, starting with the US Utilities sector.
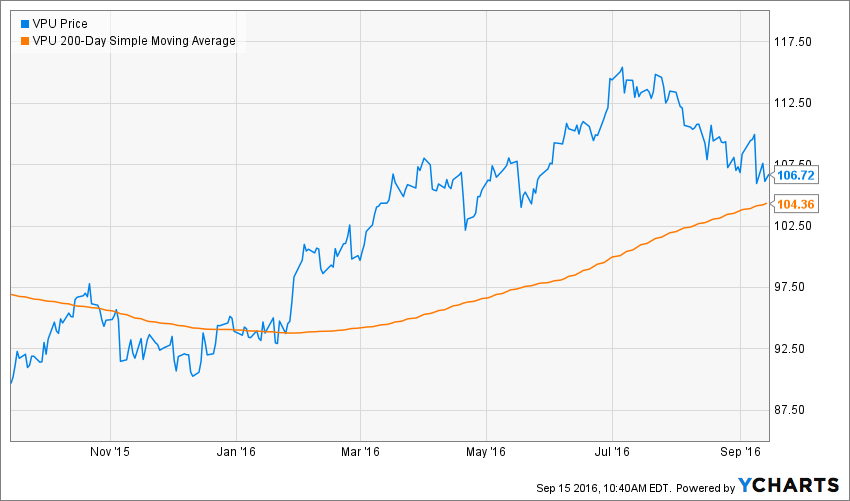
The chart above demonstrates that Utilities peaked on July 5th at $115.42 and sold off by 7.54% since that date.
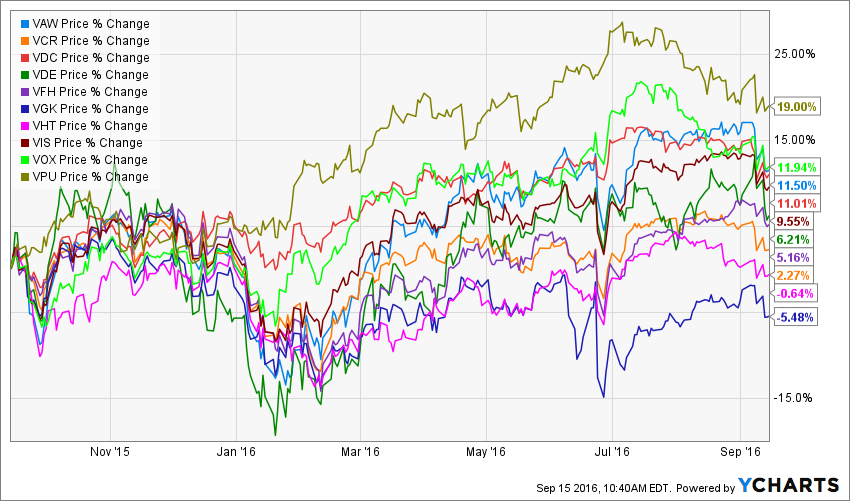
The chart above shows the performance of the 10 US sectors over the past year. Notice that Utility stocks, even after the sell-off, still, rank number one in performance.
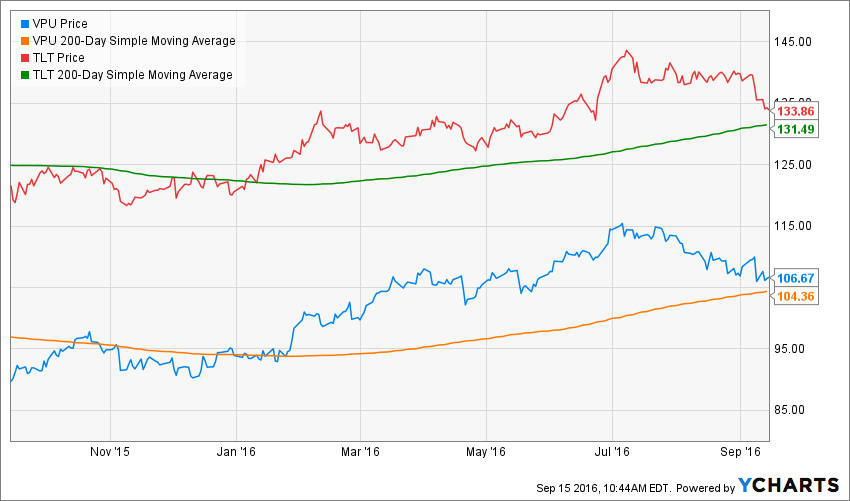
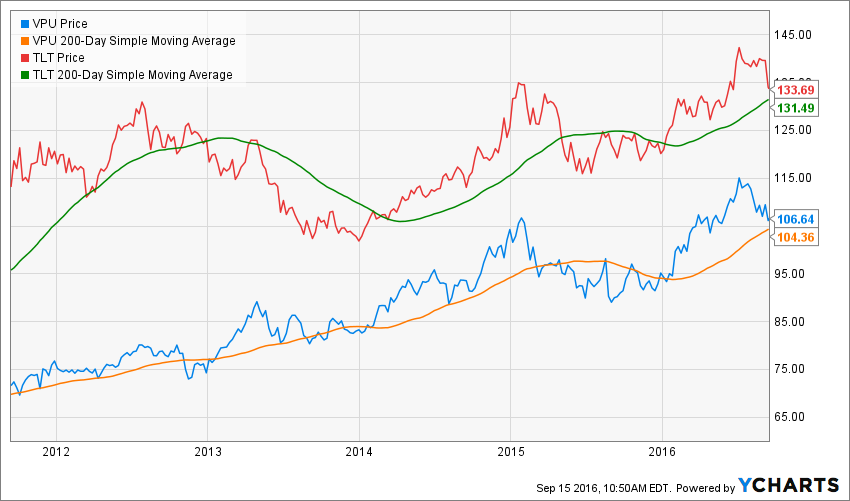
The next two charts demonstrate the correlation of Utilities to long-term bonds (TLT). VPU didn't wait for TLT to break down from a recent sideways trading range. Both TLT and VPU remain in uptrends and may recover to test the recent highs.
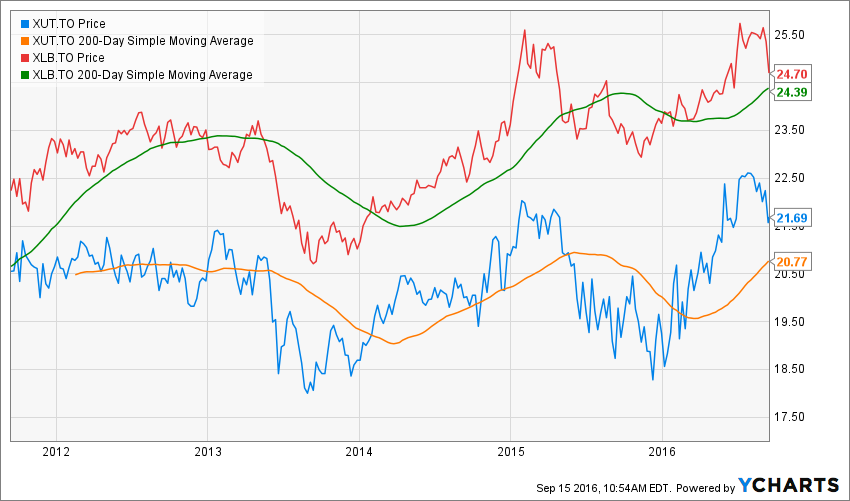
 Turning our attention to Canadian Utility stocks, you can see the same correlation between XUT.TO (Utilities) and XLB.TO (Long Bonds).
  The following table demonstrates a potential problem for utility stocks. We have selected stocks from the holdings of XUT.TO and analyzed the holdings, based on dividend yield, payout ratio, total return, EPS growth, PE ratio, and trend.

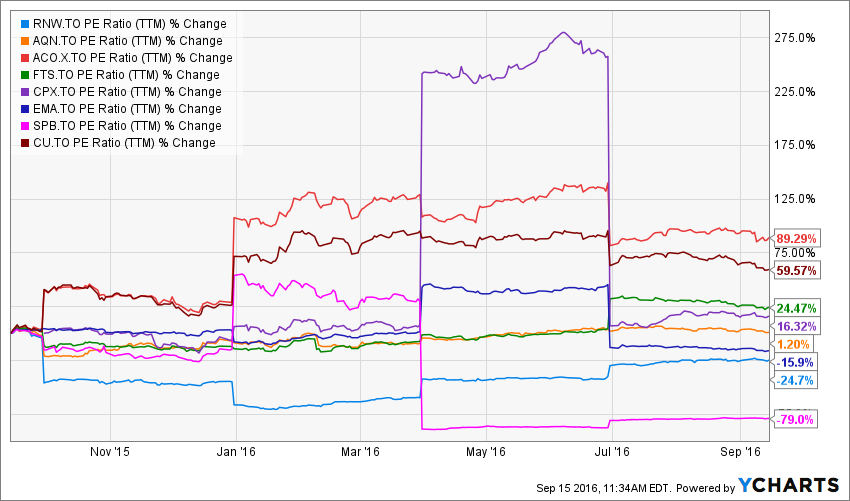
On average, this group of stocks yields 4.83%, has 3-year EPS growth of just over 3% per year for the past three years and are trading at 22.87 times earnings. 22.87 times earnings is a steep price to pay for 3% EPS growth. Notice in the chart below how price-earnings multiples have increased over the past year.
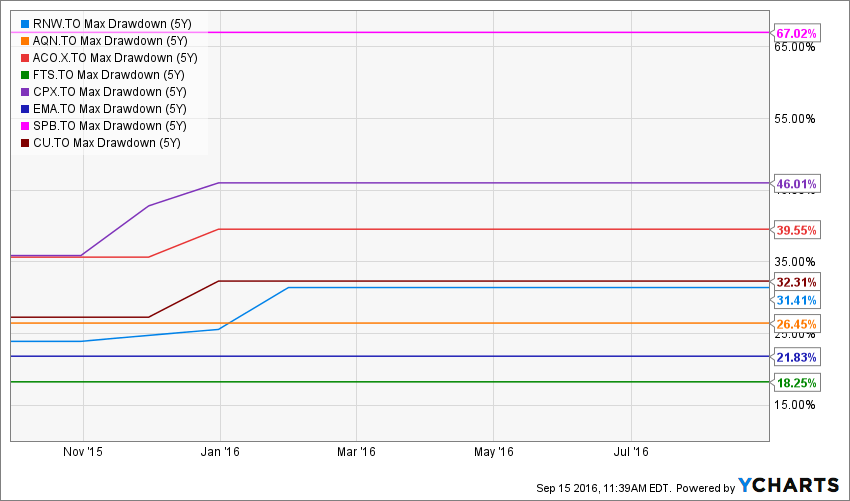
The final graphic shows maximum drawdowns for these stocks over the past five years. Notice that during a period of strong stock market performance, investors in these stocks have experienced peak-to-valley declines between 18% and 67%.
The Bottom Line
Baby Boomer investors have a significant appetite for income and utility stocks that have high yields compared to bonds, GICs and other fixed income products. These securities have provided investors with annualized returns ranging from two and thirteen percent over the past five years but between 10% and 47% over the past year.
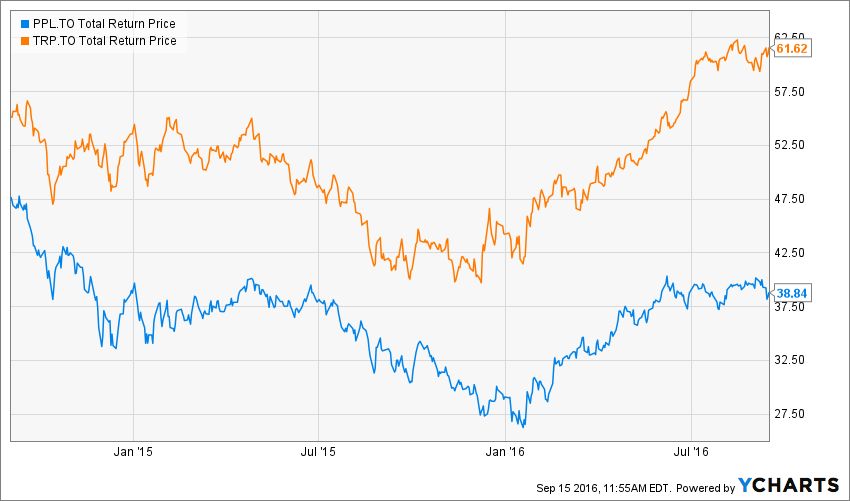
Utility stocks correlate strongly with long-term bond yields. If bond prices were to decline, investors might experience significant losses. A good example is losses experienced in pipeline stocks between September 2014 and January 2016. See the chart below.
As there is little fundamental support for Utility stocks, they will trade as long-term or perpetual bonds and the risk is higher than most advisors and clients expect.
****
Inside The Numbers is a three times a week equity/ETF feature for portfolio managers or those aspiring to be. Live sessions are held Fridays at Noon Eastern time. During these insightful sessions, a broad range of topics are discussed, ranging from financial markets, investment strategies, business development and how to use stock screening tools, like YCharts.
Synchroncity has been conducting these sessions each week since 2015 and recorded and posted them on their site. To date, they have conducted over 100 sessions with participation from a broad range of advisors across North America.
If you would like to attend live sessions, contact Bob Simpson at 905-502-0100, or via email at info@synchroncity.ca
Copyright © Synchronicity Performance Consultants


