Famous Technical Momentum Indicator Triggers a Long-Term Buy Signal for Stocks
by LPL Research
The S&P 500 Index’s Coppock Curve momentum indicator has recently closed back above zero on its monthly chart, which increases the likelihood that the stock market continues to move higher over the long-term time horizon based on historical data.
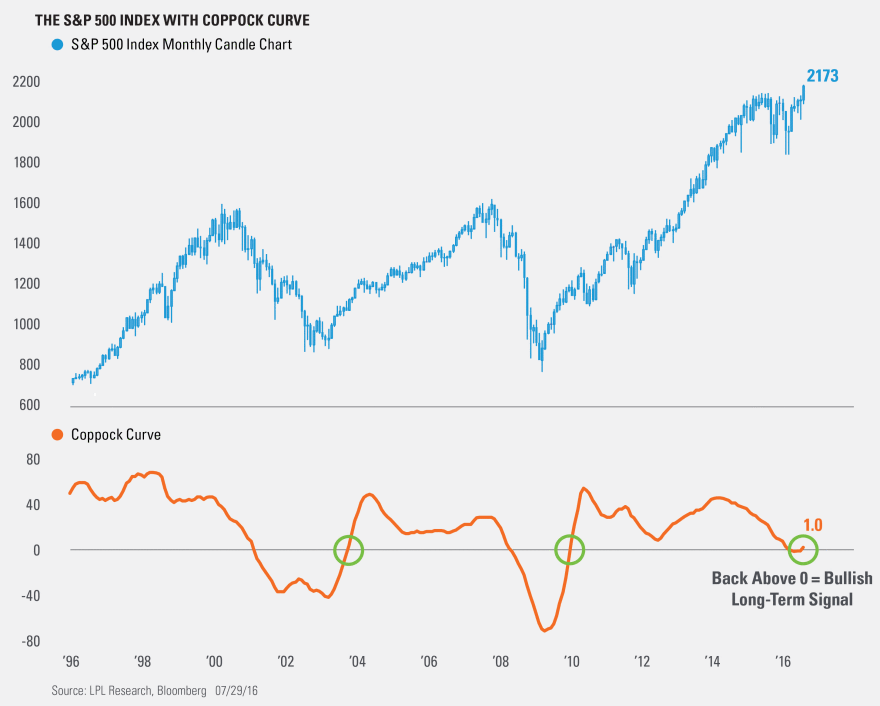
The Coppock Curve is a momentum indicator developed by Edwin “Sedge” Coppock, who originally introduced the concept in Barron’s in October 1965. This famous technical signal has a successful track record of identifying long-term buying opportunities for the S&P 500. Coppock used monthly data to identify buying opportunities when the indicator moved from negative territory to positive territory, as shown in the figure below. The Coppock Curve tracks how fast the S&P 500 stocks are rising today versus 11 and 14 months ago; it is designed to be long enough to effectively capture any changes in investor sentiment. The long-term nature of this signal increases the likelihood of identifying market bottoms and subsequent bullish price trends.
On July 29, 2016, the S&P 500’s monthly Coppock Curve once again moved from negative to positive territory, recording a value greater than 1.0, and increasing the likelihood for a long-term bullish trend for stocks. It is interesting to note that this is only the third time in more than 20 years that this long-term momentum indicator has triggered a buy signal.
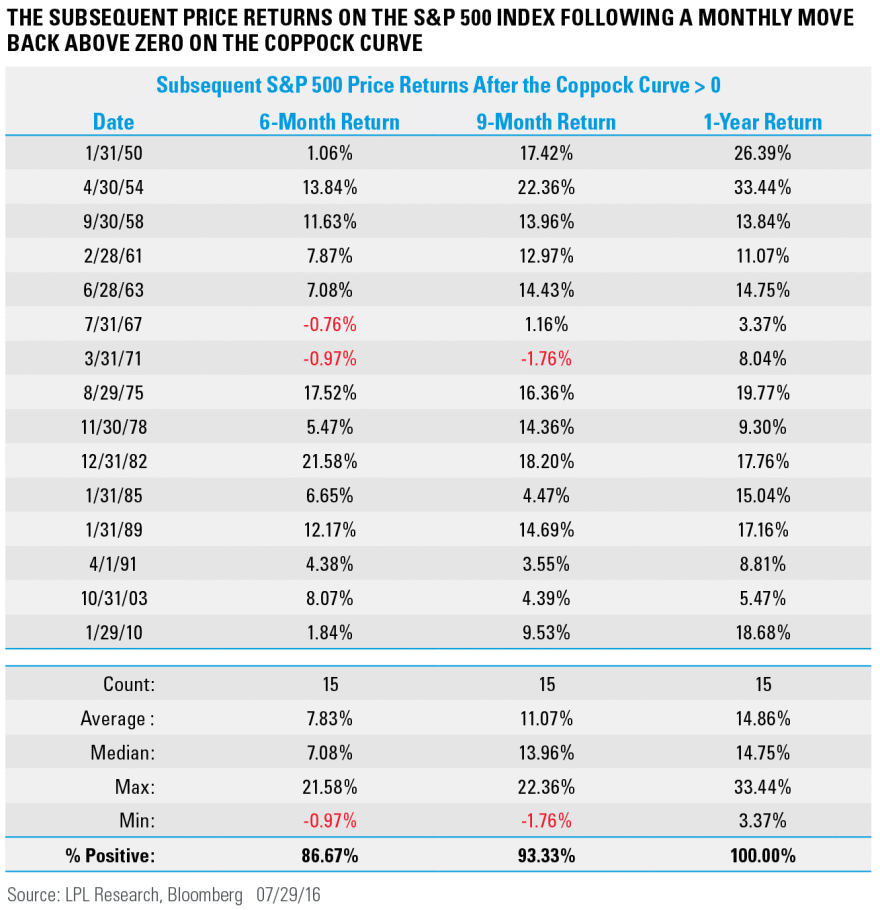
Looking at historical data going back to 1950, when the monthly reading on the S&P 500’s Coppock Curve moves back above zero, subsequent long-term price levels on the index tend to rise. Since 1950, this happened only 15 times. Six months later, the S&P 500 was higher 87% of the time, with average and median returns of 7.8% and 7.1%, respectively. Going out nine months, the returns are higher 93% of the time, with average and median returns of 11.1% and 14.0%. Looking out one year, the returns were higher 100% of the time, with average and median returns of 14.9% and 14.8%.
As we move into August and seasonal patterns that may be potentially volatile for equities, we can use an indicator such as the Coppock Curve as a tool to increase our conviction that stocks may move higher over the long term, and potentially take advantage of any short-term equity weakness as an opportunity to buy on a dip.
IMPORTANT DISCLOSURES
Past performance is no guarantee of future results. All indexes are unmanaged and cannot be invested into directly. Unmanaged index returns do not reflect fees, expenses, or sales charges. Index performance is not indicative of the performance of any investment.
The economic forecasts set forth in the presentation may not develop as predicted.
The opinions voiced in this material are for general information only and are not intended to provide or be construed as providing specific investment advice or recommendations for any individual security.
Stock investing involves risk including loss of principal.
The S&P 500 Index is a capitalization-weighted index of 500 stocks designed to measure performance of the broad domestic economy through changes in the aggregate market value of 500 stocks representing all major industries.
Candlestick: A chart that displays the high, low, opening, and closing prices for a security for a single day. The wide part of the candlestick is called the “real body” and tells investors whether the closing price was higher or lower than the opening price (black/red if the stock closed lower, white/green if the stock closed higher). The candlestick’s shadows show the day’s high and lows and how they compare to the open and close. A candlestick’s shape varies based on the relationship between the day’s high, low, opening, and closing prices.
This research material has been prepared by LPL Financial LLC.
To the extent you are receiving investment advice from a separately registered independent investment advisor, please note that LPL Financial LLC is not an affiliate of and makes no representation with respect to such entity.
Not FDIC/NCUA Insured | Not Bank/Credit Union Guaranteed | May Lose Value | Not Guaranteed by any Government Agency | Not a Bank/Credit Union Deposit
Securities and Advisory services offered through LPL Financial LLC, a Registered Investment Advisor
Member FINRA/SIPC
Tracking #1-522897 (Exp. 08/17)


