Technically Speaking: Are we in an asset bubble?
by Lance Roberts, Clarity Financial
In this past weekend’s newsletter, I reviewed the current state of the market and the risks of an August/September correction from a statistical standpoint.
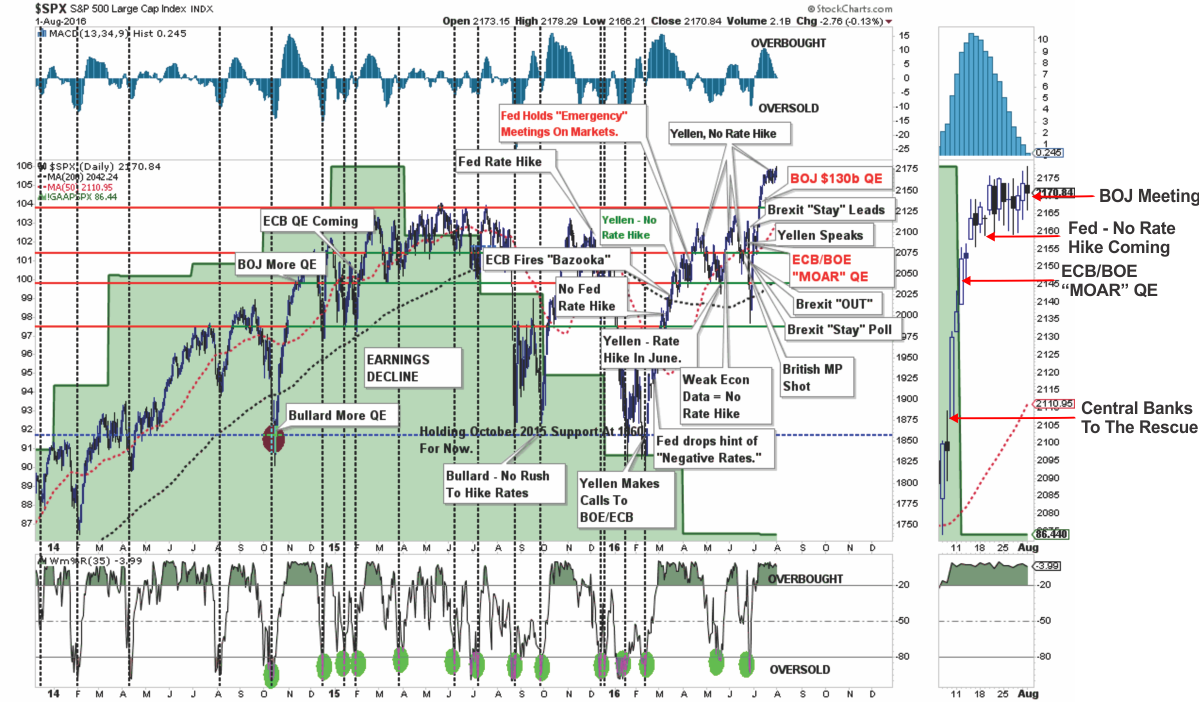
However, the important point was the stagnation of the market over the last couple of weeks following the breakout above previous resistance levels to all-time highs despite rampant concerns about the effect of the “Brexit.” This, of course, has been the result of a rapid response by global Central Banks to push enough liquidity into the system to offset any potential negative impact from the vote.
As I have noted over the past couple of weeks, the market is in the process of digesting an extreme overbought condition. As I stated this past weekend, there are two ways to accomplish this:
“Importantly, there are TWO ways to solve an overbought and overextended market advance.
The first is for the market to continue this very tight trading range long enough for the moving average to catch up with the price.
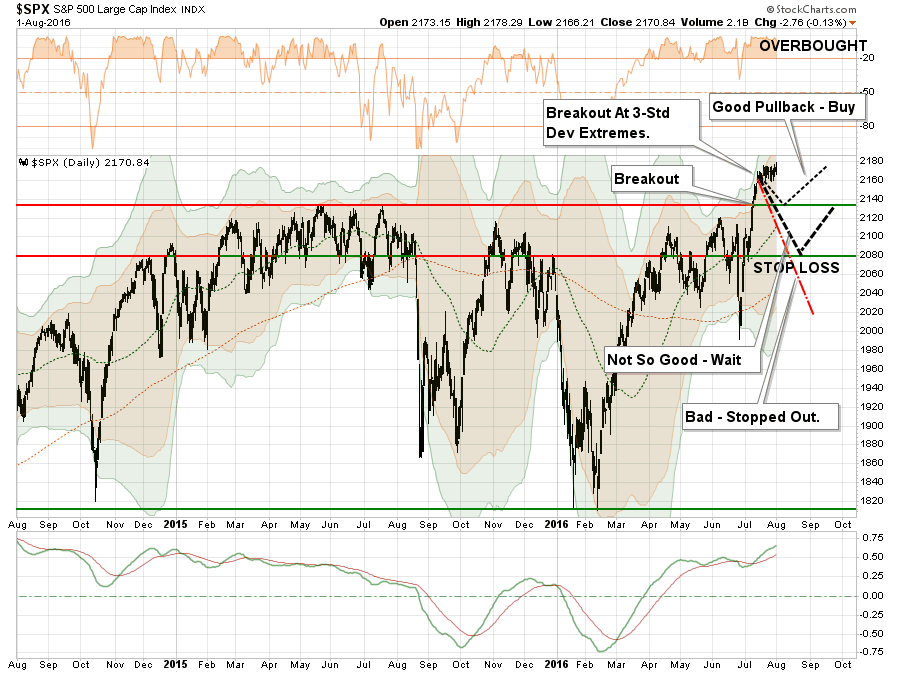
The second is a corrective pullback, which is notated in the chart below. However, not all pullbacks are created equal.
- A pullback to 2135, the previous all-time high, that holds that level will allow for an increase in equity allocations to the new targets.
- A pullback that breaks 2135 will keep equity allocation increases on ‘HOLD’ until support has been tested.
- A pullback that breaks 2080 will trigger ‘stop losses’ in portfolios and confirm the recent breakout was a short-term ‘head fake.’
With the markets still at a rather extreme deviation from the intermediate-term moving average, the likelihood of a corrective action in the short-term outweighs the probability of a further advance.”
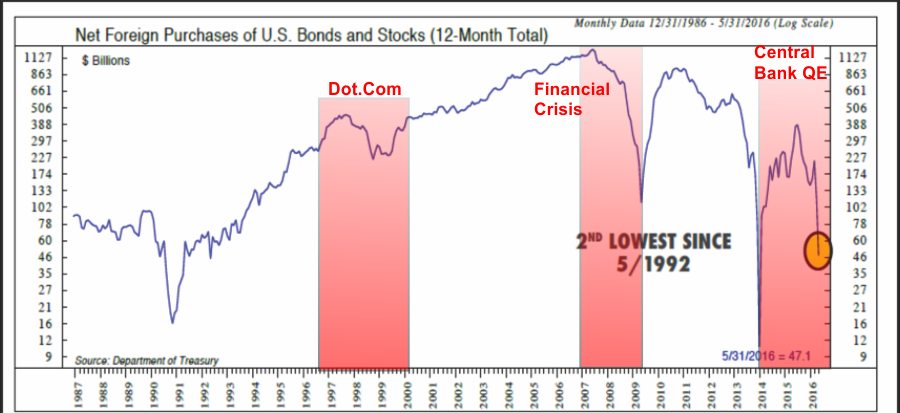
There is one other point of concern at the moment. One of the more important supports of the bull market advance has been a strong flow of foreign funds into the domestic markets to chase a higher yield. The last time we saw a reversal of flows of this magnitude was during more important domestic and globally related events that led to market contractions. Via Bloomberg:
“In May, official institutions abroad raced out of U.S. stocks and bonds with $26 billion of outflows. Private buyers abroad were, by contrast, net buyers of U.S. securities, but that wasn’t enough to keep the total positive: foreign flows out of U.S. securities totaled $11 billion, according to the most recently available data in May, sharply reversing April’s $80.4 billion of inflows.”
Interesting.
No Asset Bubble?
Speaking of previous asset bubbles, what really struck me as of late is the universal belief by a large majority of analysts, economists, and commentators, suggesting there is currently “no evidence” of an asset bubble.
Maybe that is true.
However, it should be remembered “asset bubbles” are only seen after the fact. None of the individuals currently suggesting the lack of a bubble either weren’t in the markets during the last two OR didn’t see it until well after the fact. Hindsight is not very useful when it comes to investing.
While I am not stating that we are in a bubble currently, there is some rather compelling evidence we might be.
Corporate Profits
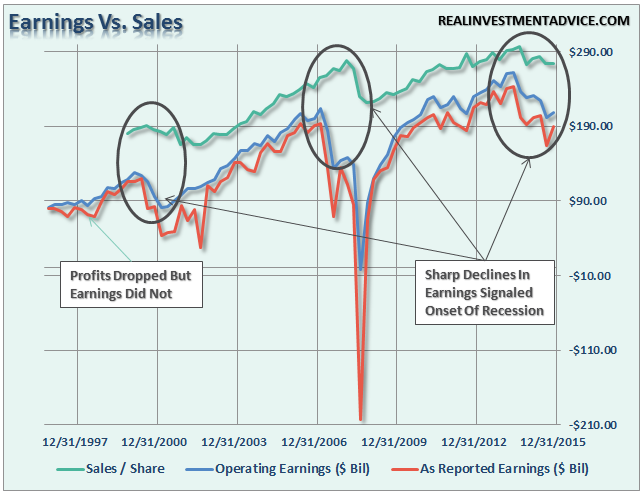
Looking at corporate profitability in a vacuum can be a bit misleading. Today, there are contributing factors to corporate profitability that did not exist previously such as the change to FASB Rule 157 which changed mark-to-market accounting, the excessive use of loan-loss reserves and other accounting gimmickry. Regardless, what is more important than the level of profits is the relative growth trend of those profits. The chart below shows top line sales versus reported and operating earnings. The last two major market peaks have coincided with earnings topping, and beginning to weaken, much like we are seeing currently.
While the level of corporate profitability is certainly important – corporate profits are more of a reflection of the issues that have historically led to asset bubbles. Increases in leverage, speculative investing and the push for yield, are more attributable to historic asset bubbles from the peak in 1929, the technology bubble in 2000 or the housing bubble in 2008. For example, the housing bubble that started in 2003, which was built around excess credit and leverage as homes were turned into ATM’s – led to a surge in corporate profitability and economic growth. However, the growth of corporate profitability did little to deter what happened next.
Let’s look at those three “road signs” more closely.
Chasing Safety
The current “chase low volatility/safe haven assets” is very likely the bubble that will be identified in hindsight.
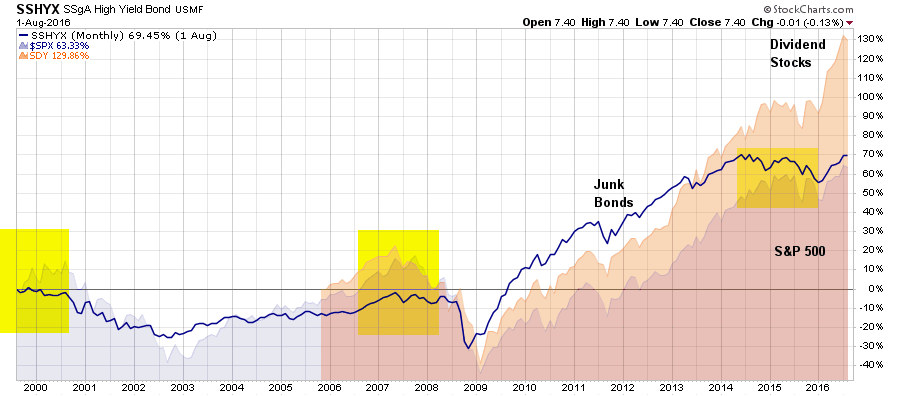
When investors have little, or no, fear of losing money in the market they begin to seek the things with the greatest returns. Over the last few years the chase for yield, due to the Fed’s consistent push to suppress interest rates, has driven investors into taking on additional credit risk to increase incomes. That same yield chase has manifested itself also in a massive outperformance of “dividend yielding stocks” over the broad market index.
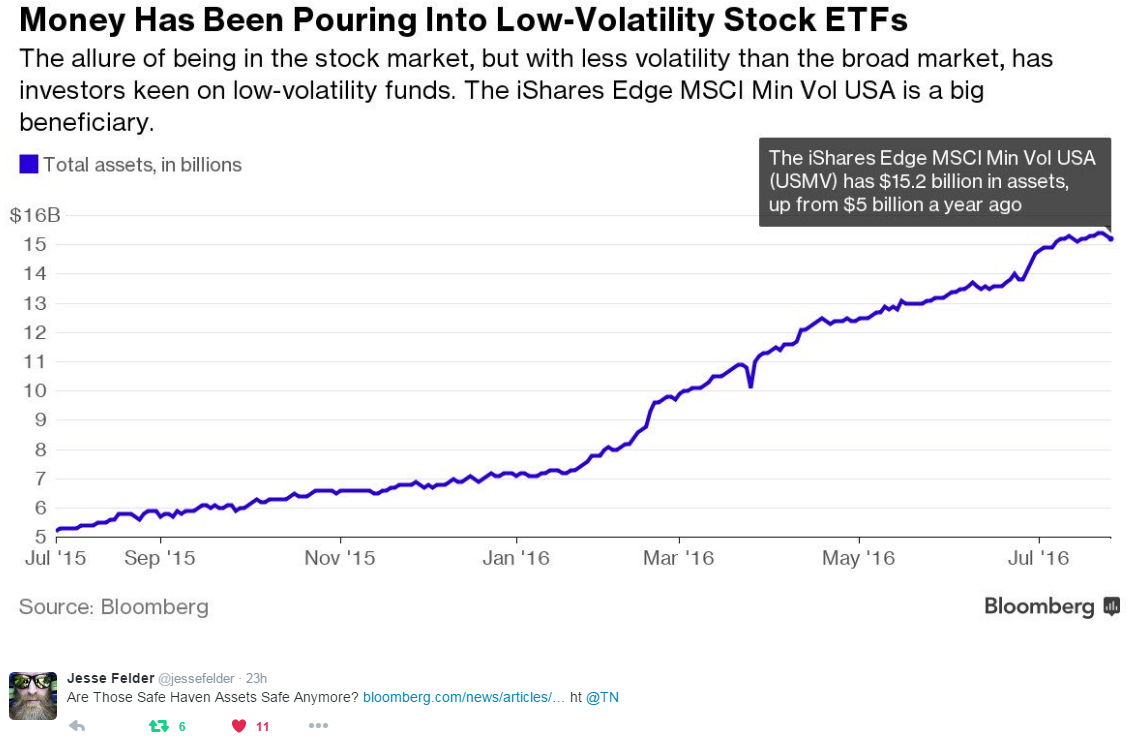
The chart shows investors are rapidly taking on excessive credit risk which is driving down yields in bonds and pushing up valuations in traditionally mature companies into stratospheric valuations. As noted recently by Jesse Felder during historic market corrections, money has traditionally hidden in “safe assets.” This time, such a rotation may be the equivalent of jumping from the “frying pan into the fire.”
Are Those Safe Haven Assets Safe Anymore? https://t.co/sauqge6ufl ht @TN pic.twitter.com/eWtFvp1f9H
Loving Leverage
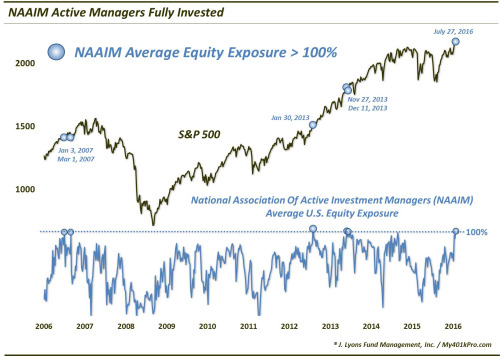
The downfall of all investors is ultimately “greed.” Greed can be measured a couple of ways. The first, as noted by Dana Lyons just recently, is the allocation to equities. Historically, this has been a good measure of the “risk appetite” of investors.
“That said, regardless of the investment acumen of any group (we think it is very high among NAAIM members), once the collective investment opinion or posture becomes too one-sided, it can be an indication that some market action may be necessary to correct such consensus. As we mentioned, that may indeed be the case with the NAAIM Exposure Index, as last week’s survey indicated an average of over 100% exposure to U.S. equities by its respondents. That is just the 6th reading over 100% in the survey’s 10-year history.”
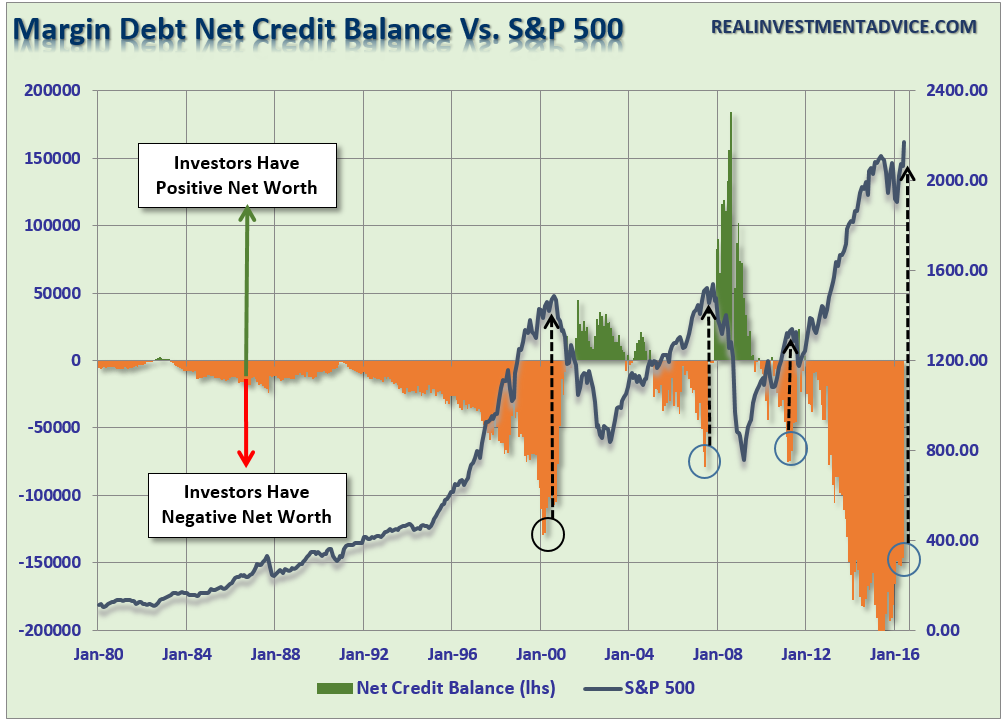
We can also look at how much leverage investors are taking on. The chart below is the amount of investor’s relative positive or negative net credit balances as compared to the index itself.
With both margin debt and negative net credit balances reaching levels not seen since the peak of the last cyclical bull market cycle it should raise some concerns about sustainability currently. It is the unwinding of this leverage that is critically dangerous in the market as the acceleration of “margin calls” lead to a vicious downward spiral. While this chart does not mean that a massive market correction is imminent – it does suggest that leverage, and speculative risk taking, are likely much further along than currently recognized.
Pushing Extremes
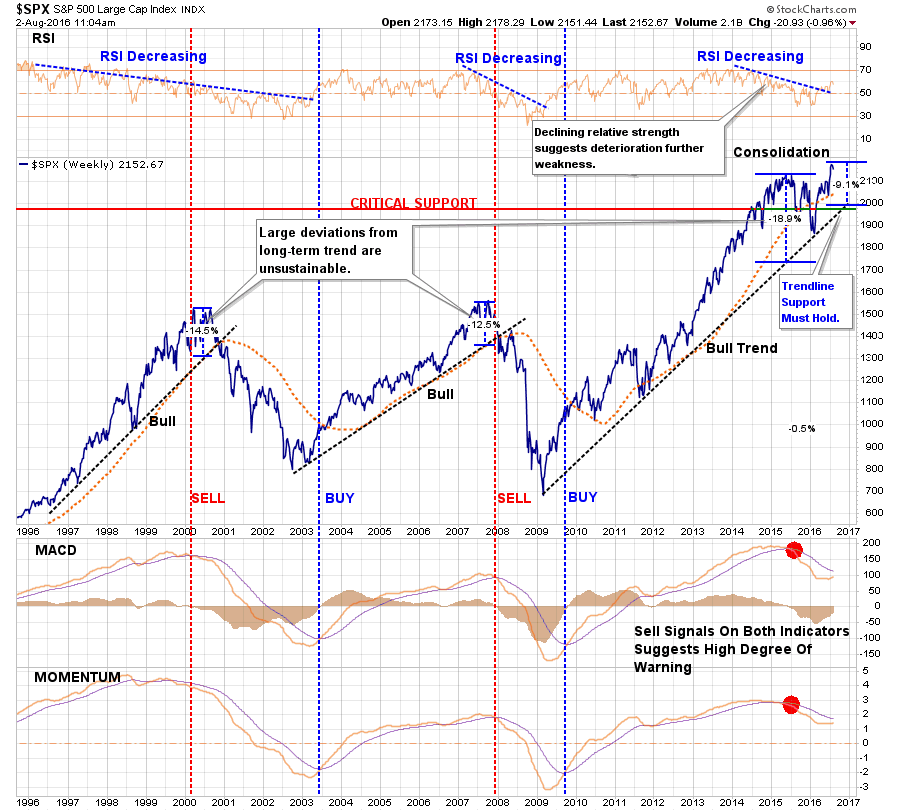
Prices are ultimately affected by physics. Moving averages, trend lines, etc. all exert a gravitational pull on prices in both the short and long-term. Like a rubber-band, when prices are stretched too far in one direction, they tend to snap back quickly. It is these reversions, both short and long-term, that generally take investors by surprise because they happen so quickly.
The current deviation of over 9% from the long-term trendline is one of the larger in history. This deviation also comes at a time when long-term MACD and Momentum measures are on historic “sell signals.” Such a combination has not turned out well for investors in the past.
The ongoing monetary actions by global Central banks has created a “Pavlovian” response in the markets. When Central Banks ring the proverbial “bell,” investors have rushed to buy in some of the most speculative areas of the market under the assumption they will always be bailed out. However, such is unlikely to always be the case and the massive increase in speculative risks, combined with excess leverage, leave the markets vulnerable to a sizable correction at some point in the future.
The only missing ingredient for such a correction currently is simply a catalyst to put “fear” into an overly complacent marketplace. There is currently no shortage of catalysts to pick from an economic disruption, another Eurozone related crisis, or an unexpected shock from an area yet to be on our radar.
In the long term, it will ultimately be the fundamentals that drive the markets. Currently, the deterioration in the growth rate of earnings, and economic strength, are not supportive of the speculative rise in asset prices or leverage. The idea of whether, or not, the Federal Reserve, along with virtually every other central bank in the world, are inflating the next asset bubble is of significant importance to investors who can ill afford to once again lose a large chunk of their net worth.
It is all reminiscent of the market peak of 1929 when Dr. Irving Fisher uttered his now famous words:
“Stocks have now reached a permanently high plateau.”
The clamoring of voices that the bull market is just beginning is telling much the same story. History is replete with market crashes that occurred just as the mainstream belief made heretics out of anyone who dared to contradict the bullish bias.
Does an asset bubble currently exist? Ask anyone and they will tell you “NO.” However, maybe it is exactly that tacit denial which might just be an indication of its existence.
Lance Roberts is a Chief Portfolio Strategist/Economist for Clarity Financial. He is also the host of “The Lance Roberts Show” and Chief Editor of the “Real Investment Advice” website and author of “Real Investment Daily” blog and “Real Investment Report“. Follow Lance on Facebook, Twitter, and Linked-In
Copyright © Clarity Financial


