
SIA Equity Leaders Weekly: How are Canadian and U.S. Real Estate Sectors Doing?
For this week’s edition of the Equity Leaders Weekly, we are going to take a look at the real estate sectors on both sides on the border once again. We last looked at this sector back on June 23, 2016. Real estate has continued to remain in the favored zone in both the Canadian and U.S. ETF and mutual fund sector reports. To examine both the Canadian and US real estate sectors, we will take a look at the BMO Equal Weight REITs Index ETF (ZRE.TO) and the iShares US Real Estate ETF (IYR).
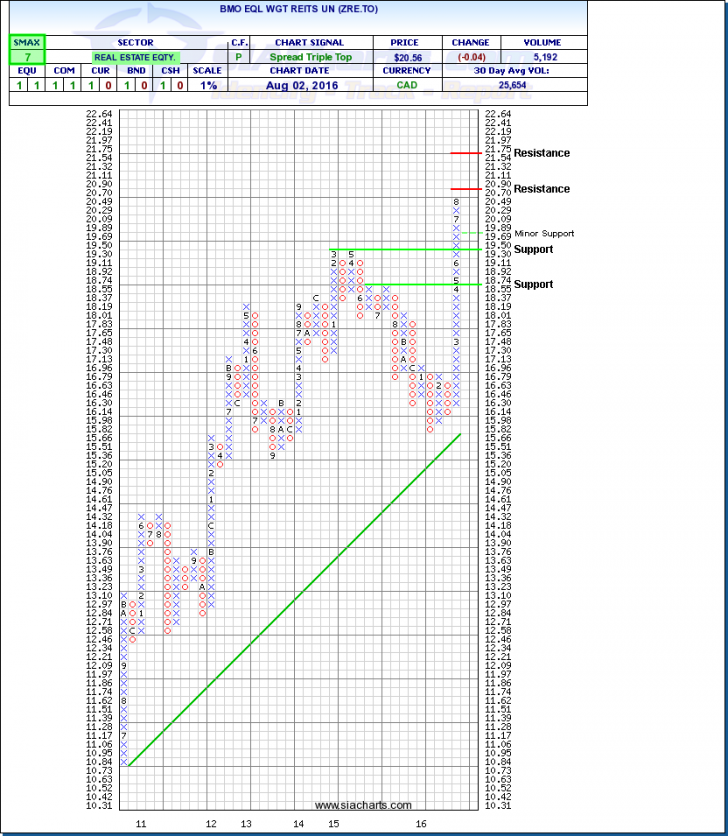
BMO Equal Weight REITS Index ETF (ZRE.TO)
The BMO Equal Weight REITS Index ETF (ZRE.TO) seeks to track the Dow Jones Canada Select Equal REIT Index. In looking at the attached chart, we can see that ZRE.TO is continuing in its strong uptrend posting 6 straight months of positive moves dating back to February of this year and is approaching resistance at $20.90. If this trend were to reverse, we can find support for ZRE.TO at $19.30 and below at $18.55. With an SMAX score of 7 out of 10, ZRE.TO is showing near term strength relative to the broad asset classes.
A benefit to real estate is that it can provide diversification to a portfolio and add a piece that is traditionally less correlated to equities markets and thought of as a good inflation hedge. For most, real estate investing is limited to home ownership, however REITs can allow an investor ownership of commercial properties such as office towers, shopping malls or industrial warehouses. Because of their corporate structure, they have tax advantages which in turn result in higher dividend yields. REITs can offer another income component to a portfolio, without having to increase exposure to dividend paying equities.
On another note, two of the hottest real estate markets in Canada are Vancouver and Toronto. The Province of BC just implemented this week, and Ontario is considering, a new tax on foreign real estate investors. It is unknown the effects of this tax, however it will be interesting to watch what, if any, effects it may have on the Canadian real estate market.
Please note that we have used a 1% point and figure chart analysis of ZRE.TO just as we have the last two times we wrote about it in the ELW to stay consistent with the past commentary. A 1% box size was used to look at a shorter time frame to see more movement of the Canadian real estate market over the last few years.
Click on Image to Enlarge
iShares U.S. Real Estate ETF (IYR)
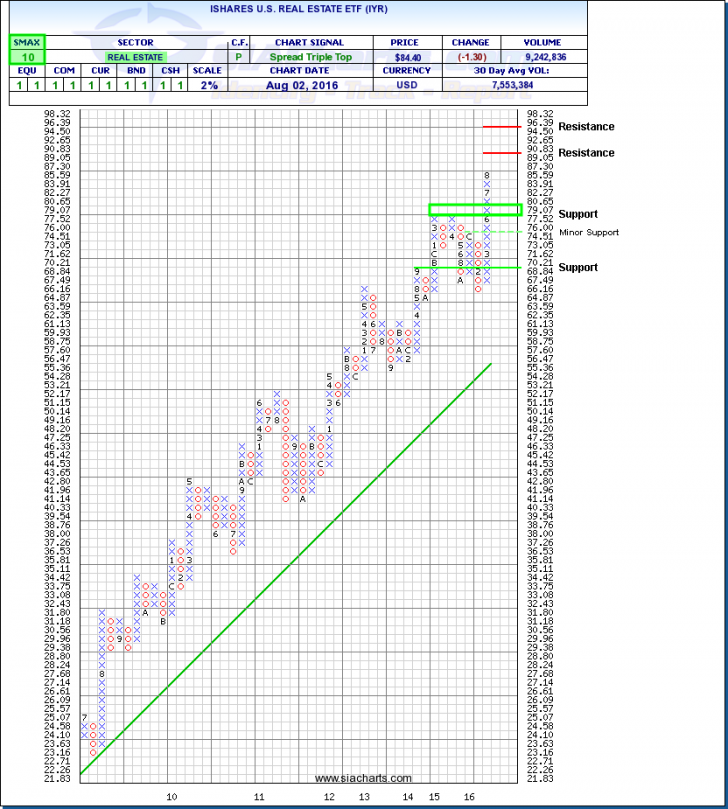
Next we will take a look at a 2% chart of the the iShares U.S. Real Estate ETF (IYR). This ETF tracks the Dow Jones U.S. Real Estate Index which is comprised of both real estate holdings as well as real estate investment trusts. The chart for IYR shows 6 months without a three box reversal and approaching resistance at $90. Through this level, we could see more resistance come into play at $95. To the downside, IYR has support at ~$80 and ~$70.
Real estate tends to perform well in a low interest rate environment as spending is often financed using debt so US interest rate policy will be key to focus on going forward when making a real estate investment. With an SMAX score of 10 out of 10, IYR is exhibiting strength against the asset classes.
For a more in-depth analysis on the relative strength of the equity markets, bonds, commodities, currencies, etc. or for more information on SIACharts.com, you can contact our customer support at 1-877-668-1332 or at siateam@siacharts.com.
Click on Image to Enlarge
SIACharts.com specifically represents that it does not give investment advice or advocate the purchase or sale of any security or investment. None of the information contained in this website or document constitutes an offer to sell or the solicitation of an offer to buy any security or other investment or an offer to provide investment services of any kind. Neither SIACharts.com (FundCharts Inc.) nor its third party content providers shall be liable for any errors, inaccuracies or delays in content, or for any actions taken in reliance thereon.