
How to think bigger about small cap investing
by Raman Aylur Subramanian, Equity Applied Research, MSCI
Investors who allocate to small-cap stocks can use either a benchmark weighted according to the market value of companies that constitute it or indexes that track the performance of factors such as size. But all small-cap indexes are not the same.
The MSCI USA Small Cap Index is carved out from the MSCI USA Investable Market Index (IMI), which includes large-, medium- and small-cap stocks but filters out micro caps. As can be seen in the chart below, the average market capitalization of the smallest companies in the IMI is roughly $400 million, which puts them between the average size of companies in deciles six and seven in the universe of U.S. listed companies.
MSCI benchmarks filter out micro-cap stocks
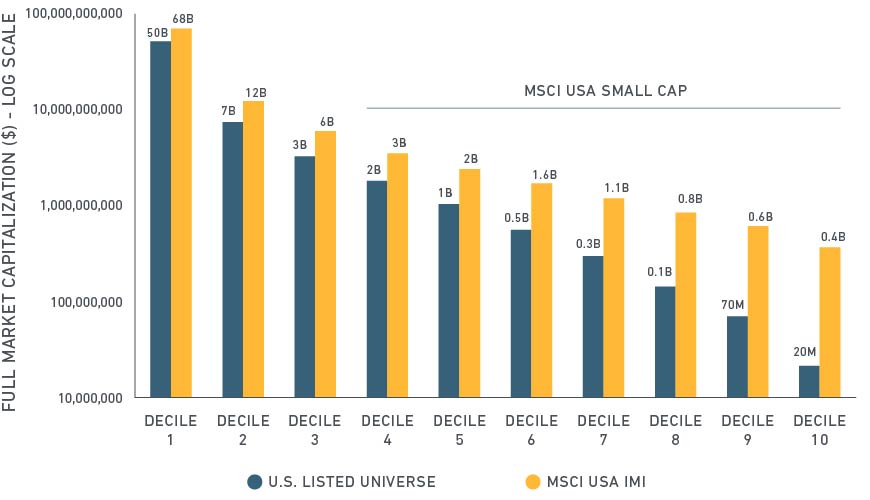
Excluding micro-cap stocks can contribute consistency and investability to indexes. Micro caps historically have displayed greater stock-specific volatility and lower liquidity compared to small-cap stocks, as we see in the below exhibit. These differences can become even more important during a downturn or in periods of volatility. Research by MSCI has found a significant difference in the liquidity of companies in the bottom two deciles of U.S. companies generally, compared with the bottom deciles of the IMI. The bottom decile of the U.S. listed universe revealed very poor liquidity over time whereas the bottom decile of the IMI remained fairly liquid by comparison.
Micro caps tend to be more volatile and less liquid than small caps
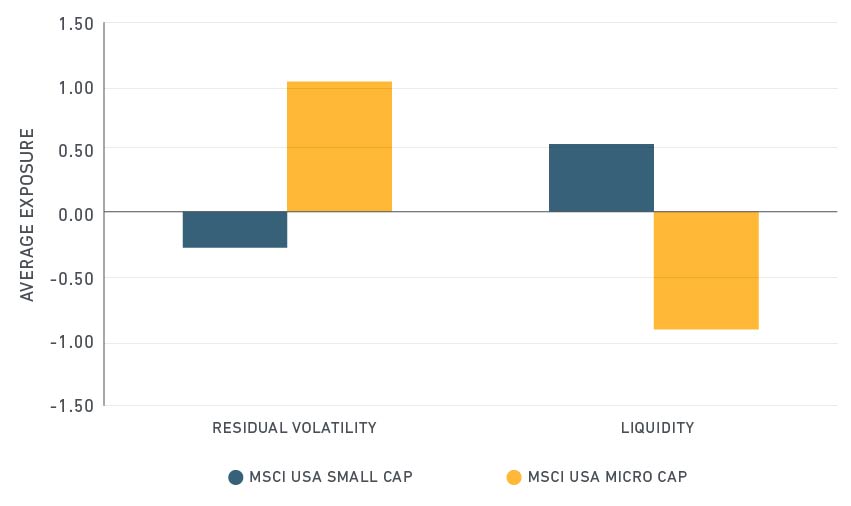
Average exposures from Nov. 30, 2007 to May 31, 2016 using MSCI’s Long-Term Global Equity Model (GEMLT)
Source: MSCI Research
Because of lower liquidity, micro-cap stocks can be less easy to trade. The table below shows the number of days it would take to replicate an index that consists of small- and micro-cap stocks, assuming you had $1 billion to allocate. Assuming a maximum daily trading limit of 20%, the MSCI USA Small + Micro Cap Index would have taken up to 20 days to replicate, based on our simulation. The MSCI USA Small Cap Index would have taken only three days. That’s a big difference, particularly for managers who replicate the index passively.
Micro-cap stocks can be less easy to trade

*Average of last four index reviews ending 31-May-2016 and a maximum daily trading limit of 20%
Searching for the size effect
The size effect reflects excess returns of smaller companies compared with their larger counterparts. In addition to a market cap-weighted approach, investors can capture the size effect via a multi-factor approach. The table below compares the MSCI USA Index (large- and mid-cap companies) with the MSCI USA Small Cap Index, the MSCI USA Small Cap Diversified Multiple Factor (DMF) Index (which maximizes exposure to the value, momentum, quality and low size factors), and the MSCI USA Equal Weighted Index (which removes the influence of each stock’s current price).
Characteristics of low-size strategies
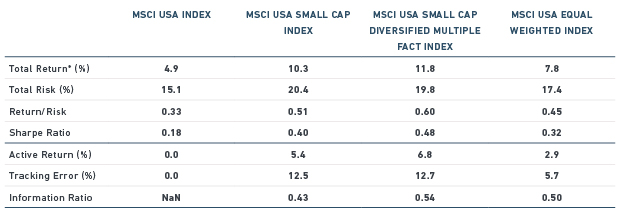
Period: 31-Dec-1998 to 31-May-2016
Source: MSCI Research
Over the period studied, the MSCI USA Small Cap Index provided attractive risk-return characteristics relative to other size-based indexes and effectively reflected the size effect. As the chart below shows, the MSCI USA Small Cap DMF Index offers negative exposure to the size factor, which means that the index tilts toward small-cap stocks, and positive exposure to measures of quality. MSCI defines quality as high return on equity, low leverage and consistent earnings. As such, the DMF approach aims to enhance small-cap indexes by maximizing exposure to quality companies.
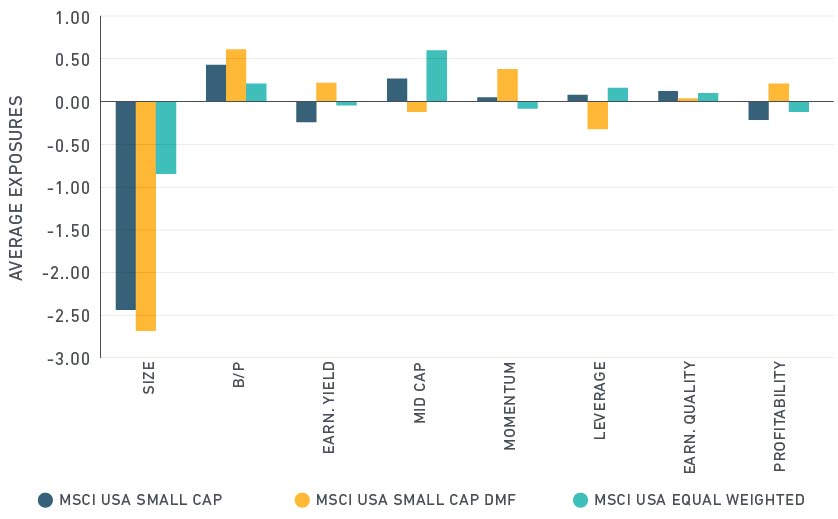
Average exposures from May 31, 1999 to May, 31, 2016 using MSCI’s GEMLT Model
A similar approach to finding the size effect works outside the U.S. The table below compares risk and return characteristics of size-based strategies across developed markets other than the U.S.
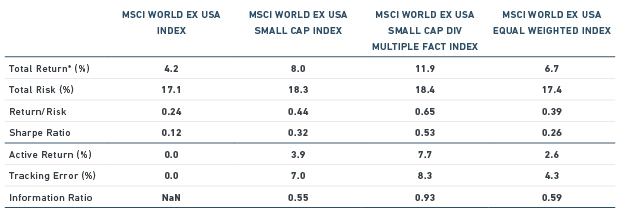
Period: 31-May-1999 to 31-May-2016
Here, too, the small-cap index exhibited attractive risk-return characteristics. The DMF version of the index enhanced risk-return attributes by tilting the index to harness low size, quality, momentum and value (below chart).
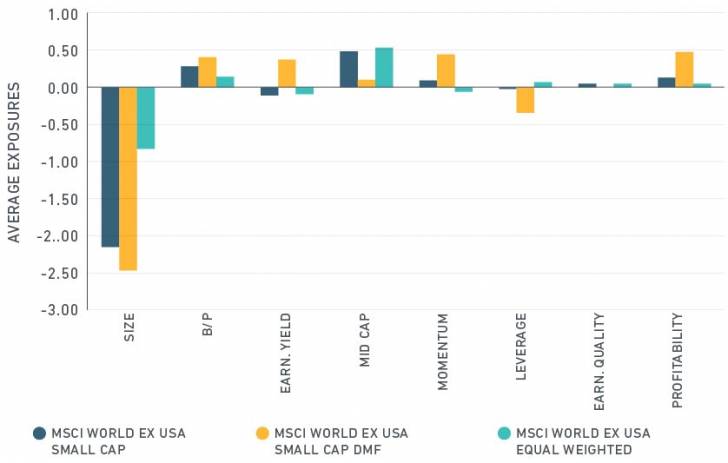
Average exposures from May 31, 1999 to May, 31, 2016 using MSCI’s GEMLT Model
As with U.S. stocks, the DMF approach in international markets offers negative exposure to the size factor while targeting quality companies in the small-cap segment of the market.
The author thanks Raina Oberoi for her valuable insight and assistance.
Further reading:
One Size Does Not Fit All: Understanding Factor Investing
Tilting to U.S. Small Caps
Copyright © MSCI