Checking Back In On Emerging Markets
by LPL Research
In our just released Midyear Outlook 2016 publication, we highlighted emerging markets (EM) as one area that could provide an opportunity in the near term. Although foreign markets in general have significantly lagged U.S. stocks during the past several years, EM valuations are extremely attractive. Coupled with the potential for a boost from both fiscal and monetary stimulus, these valuations make EM a nice area to look for diversification, along with potential outperformance.
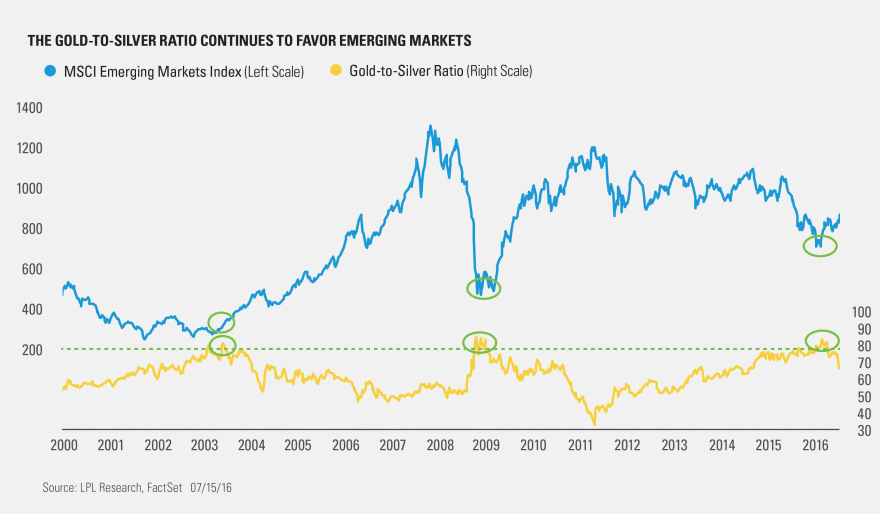
Three months ago we wrote why the gold-to-silver ratio was potentially flashing a positive sign for emerging markets. As we stated in our Midyear Outlook, we like EM thanks to their attractive valuations, but this ratio could be another reason to remain optimistic.
[Tweet "... two previous times this ratio was over 80 were good times to be bullish on EM @LPLResearch"]First, let’s explain what ratio analysis is. You determine a ratio by dividing the price of one asset by another asset and plotting it out over time. This helps to determine how extended one asset is to another.
The gold-to-silver ratio, which measures the number of silver ounces needed to buy a single ounce of gold, was recently above 80, which was the highest since late 2008 and the financial crisis. Going back to 2000, the two previous times this ratio was over 80 were good times to be bullish on EM, and once again, it looks like this could be playing out.
Silver is considered to be both a precious metal and an industrial metal. So, if industrial metals continue to improve (as we’ve been seeing the past few months), then silver should continue to do well. Given emerging markets are correlated with industrial metals, higher commodity prices will help the big commodity exporters like Brazil and Russia.
[Tweet "Silver has been on a tear—up 23% compared to a 7% gain in gold @LPLResearch"]Since we first wrote about the gold-to-silver ratio three months ago, silver has been on a tear—up 23% compared to a 7% gain in gold. In fact, silver just closed above $20/ounce for two consecutive weeks for the first time in two years. When silver outperforms gold this has historically been a good time to consider taking on additional risk in emerging markets. Updating the gold-to-silver ratio shows the ratio is firmly pointing lower, suggesting silver is outperforming gold, but it has a long ways to go before it is “low.” This may be a small clue that the recent bounce in EM could have substantial legs to it.
Thus, EM valuations are attractive and the gold-to-silver ratio is confirming potential EM outperformance. Be sure to read our entire Midyear Outlook 2016: A Vote of Confidence for more of our best ideas over the rest of this year.
Copyright © LPL Research


