by Don Vialoux, Timingthemarket.ca
Mr. Vialoux on BNN’s “Market Call Tonight” on Friday
Following are links:
Market outlook:
http://www.bnn.ca/Video/player.aspx?vid=808008
Question period:
http://www.bnn.ca/Video/player.aspx?vid=808005
http://www.bnn.ca/Video/player.aspx?vid=808022
http://www.bnn.ca/Video/player.aspx?vid=808031
http://www.bnn.ca/Video/player.aspx?vid=808056
http://www.bnn.ca/Video/player.aspx?vid=808074
http://www.bnn.ca/Video/player.aspx?vid=808086
Top picks:
http://www.bnn.ca/Video/player.aspx?vid=808082
Economic News This Week
February Empire State Manufacturing Index to be released at 8:30 AM EST on Tuesday is expected to improve to -10.0 from -19.4.
January Producer Prices to be released at 8:30 AM EST on Wednesday is expected to slip 0.2% versus a decline of 0.2% in December. Excluding food and energy, January Producer Prices are expected to improve 0.1% versus a gain of 0.1% in December.
January Housing Starts to be released at 8:30 AM EST on Wednesday are expected to increase to 1.185 million units from 1.149 million units in December
January Industrial Production to be released at 9:15 AM EST on Wednesday is expected to improve 0.2% versus a decline of 0.4% in December. January Capacity Utilization is expected to improve to 76.6% from 76.5% in December
FOMC Meeting Minutes are released at 2:00 PM EST on Wednesday
Weekly Initial Jobless Claims to be released at 8:30 AM EST on Thursday
February Philly Fed Index to be released at 8:30 AM EST on Thursday is expected to slip to -3.0 from +3.5 in January.
January Leading Economic Indicators to be released at 10:00 AM EST on Thursday are expected to drop 0.2% versus a decline of 0.2% in December
January Consumer Prices to be released at 8:30 AM EST on Friday is expected to slip 0.1% versus a decline of 0.1% in December. Excluding food and energy, January Consumer Prices are expected to increase 0.1% versus a gain of 0.1% in December
Canadian December Retail Sales to be released at 8:30 AM EST on Friday are expected to drop 0.8% versus a gain of 1.7% in November.
Canadian January Consumer Prices to be released at 8:30 AM EST on Friday are expected to increase 0.1% versus a decline of 0.5% in December. Excluding food and energy, January Consumer Prices are expected to increase 0.2% versus a decline of 0.4% in December.
Earnings News This Week
StockTwits Released on Friday
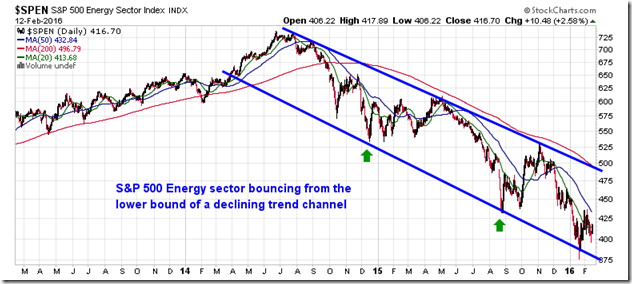
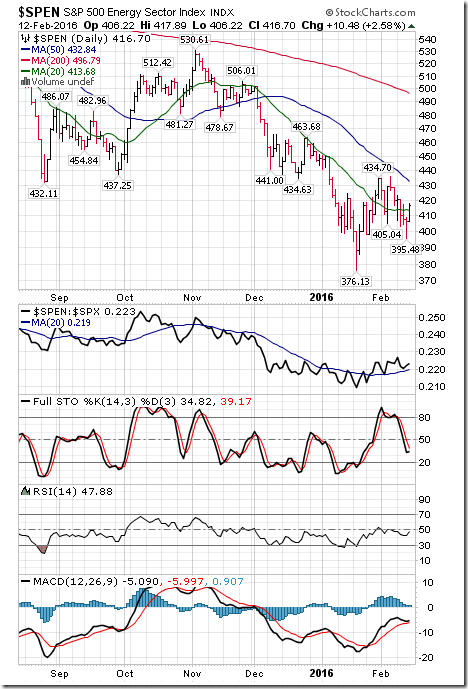
S&P Energy Sector Index bouncing from the lower limit of a long-term declining trend channel.
Technical action by S&P 500 stocks to 10:00: Quiet. Breakouts: $VRXN, $WIN. Breakdown: $XRAY
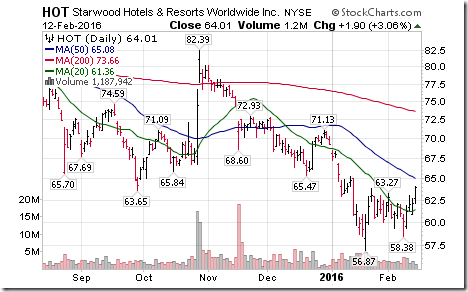
Editor’s Note: After 10:00 AM, breakouts were recorded by DNB, HOT, MAR and WYNN
Nice breakout above base building patterns for U.S. hotel stocks: $HOT, $MAR, $WYN
The Bottom Line
More technical evidence surfaced last week that confirmed an intermediate bottom for most equity indices, commodities and sectors on January 21st. Energy, Materials and Industrials continued to show strength relative to the S&P 500 Index, an encouraging technical sign for this time of year. Short term momentum indicators fell to oversold levels and showed early signs of bottoming on Friday. Preferred strategy is to accumulate favoured sectors, markets and commodities as they build base building patterns prior to resumption of an intermediate uptrend.
Equity Indices
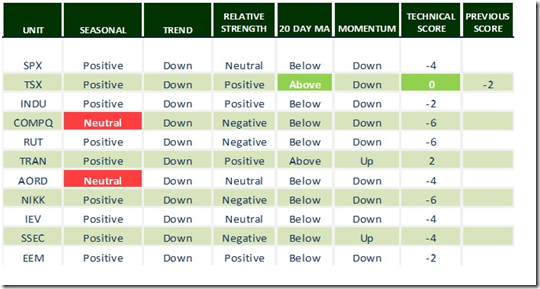
Daily Seasonal/Technical Equity Trends for February 12th 2016
Green: Increase from previous day
Red: Decrease from previous day
Calculating Technical Scores
Technical scores are calculated as follows:
Intermediate Uptrend based on at least 20 trading days: Score 2
Higher highs and higher lows
Intermediate Neutral trend: Score 0
Not up or down
Intermediate Downtrend: Score -2
Lower highs and lower lows
Outperformance relative to the S&P 500 Index: Score: 2
Neutral Performance relative to the S&P 500 Index: 0
Underperformance relative to the S&P 500 Index: Score –2
Above 20 day moving average: Score 1
At 20 day moving average: Score: 0
Below 20 day moving average: –1
Up trending momentum indicators (Daily Stochastics, RSI and MACD): 1
Mixed momentum indicators: 0
Down trending momentum indicators: –1
Technical scores range from -6 to +6. Technical buy signals based on the above guidelines start when a security advances to at least 0.0, but preferably 2.0 or higher. Technical sell/short signals start when a security descends to 0, but preferably -2.0 or lower.
Long positions require maintaining a technical score of -2.0 or higher. Conversely, a short position requires maintaining a technical score of +2.0 or lower.
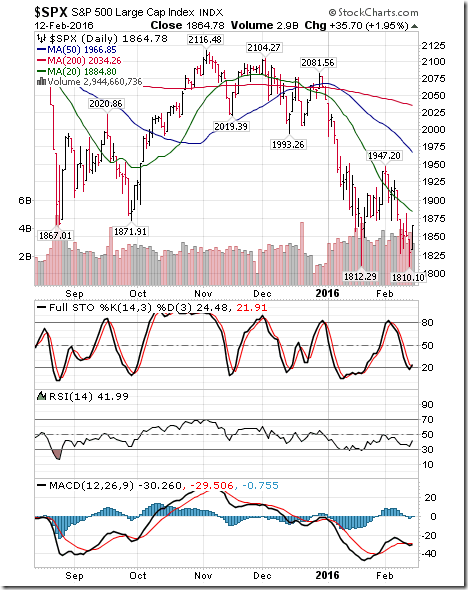
The S&P 500 Index lost 15.24 points (0.81%) last week despite a gain of 1.95% on Friday. Intermediate trend remains down. The Index remains below its 20 day moving average. Short term momentum indicators are trending down, but are oversold and showing early signs of bottoming. Likely double bottom pattern?
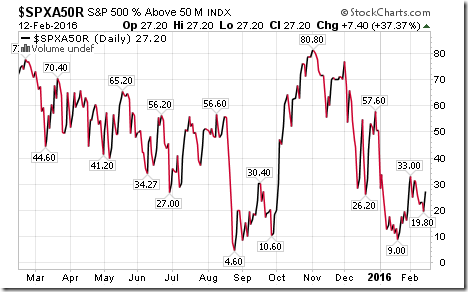
Percent of S&P 500 stocks trading above their 50 day moving average increased last week to 27.20% from 25.60%. Percent bottomed on January 21st at 9.00% and remains in an intermediate uptrend.
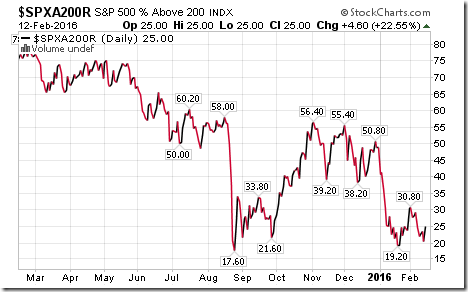
Percent of S&P 500 stocks trading above their 200 day moving average increased last week to 25.00% from 24.80%. Percent bottomed on January 21st and remain in an intermediate uptrend.
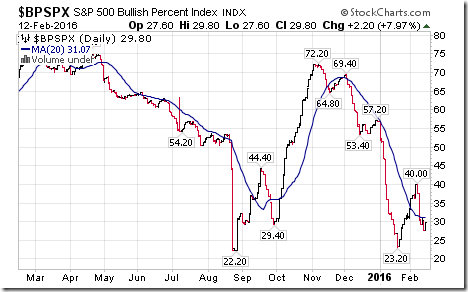
Bullish Percent Index for S&P 500 stocks fell last week to 29.80% from 37.60% and slipped below its 20 day moving average. An intermediate low was set on January 21st at 23.20%.
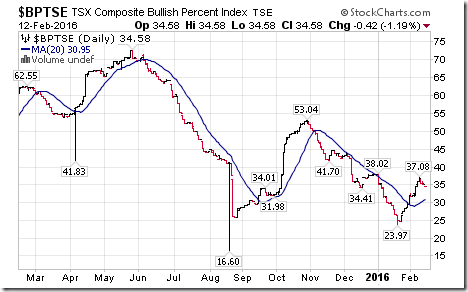
Bullish Percent Index for TSX Composite stocks slipped last week to 34.58% from 35.83%. The Index remains above its 20 day moving average. An intermediate low was set on January 21st at 23.97%.
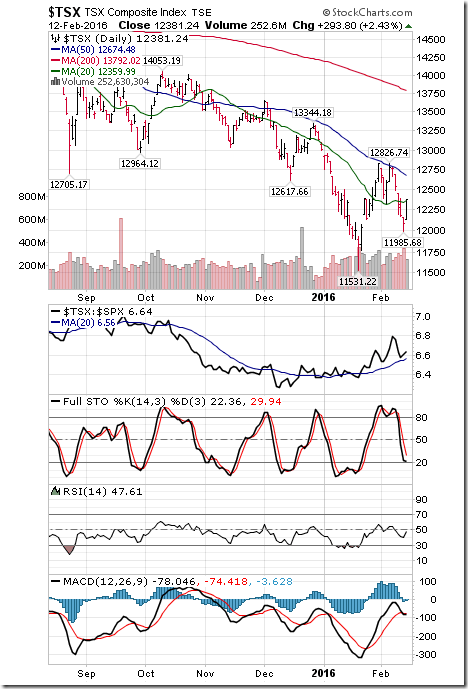
The TSX Composite Index fell 382.75 points (3.00%) last week despite a gain of 2.43% on Friday. Intermediate trend remains down (Score: -2). Strength relative to the S&P 500 Index remains positive (Score: 2). The Index recovered back above its 20 day moving average on Friday (Score: 1). Short term momentum indicators are trending down (Score: -1), but are oversold and showing early signs of bottoming. Technical score last week slipped to 0 from 2
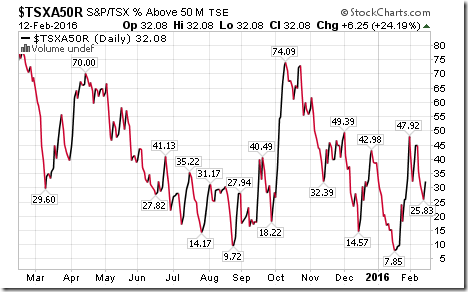
Percent of TSX stocks trading above their 50 day moving average dropped last week to 32.08% from 45.00%. Percent reached an intermediate bottom at 7.85% on January 21st
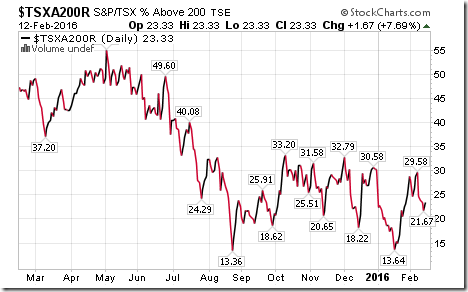
Percent of TSX stocks trading above their 200 day moving average dropped last week to 23.33% from 29.58%. Percent reached an intermediate bottom at 13.64% on January 21st
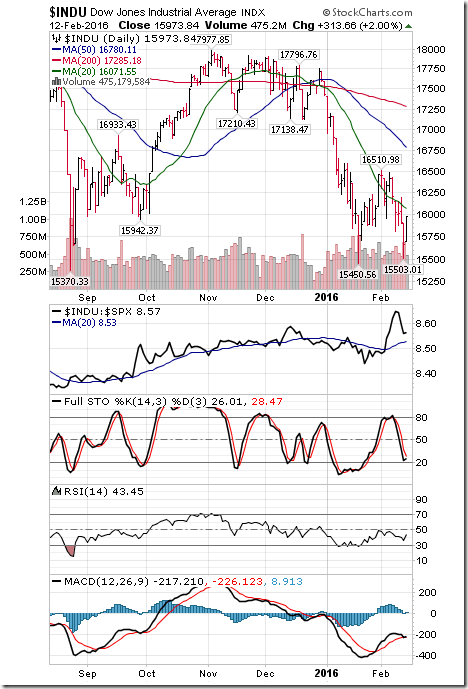
The Dow Jones Industrial Average dropped 230.99 points last week (1.43%) last week despite a gain of 2.00%0 on Friday. Intermediate trend remains down. Strength relative to the S&P 500 Index remains positive. The Index moved below its 20 day moving average last week. Short term momentum indicators are trending down, but are oversold and showing early signs of bottoming. Technical score dropped last week to -2 from 2.
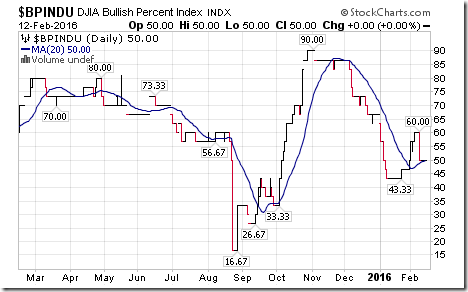
Bullish Percent Index for Dow Jones Industrial Average stocks dropped last week to 50.00% from 60.00% and slipped back to its 20 day moving average.
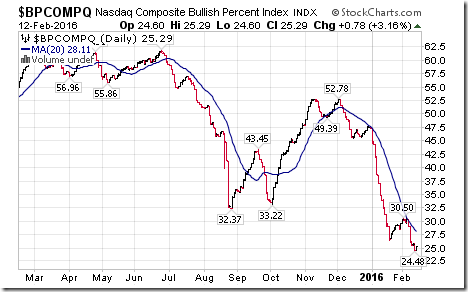
Bullish Percent Index for NASDAQ Composite stocks dropped last week to 25.29% from 28.95% and remained below its 20 day moving average.
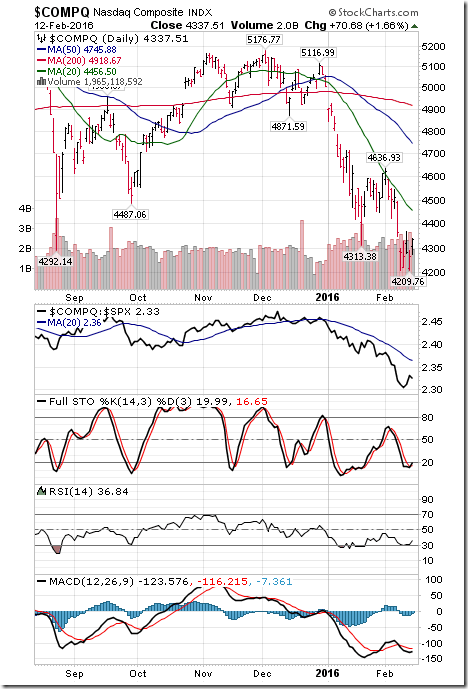
The NASDAQ Composite Index dropped 25.63 points (0.59%) last week. Intermediate trend remains down. Strength relative to the S&P 500 Index remains negative. The Index remains below its 20 day moving average. Short term momentum indicators are trending down, but are oversold and showing early signs of bottoming.
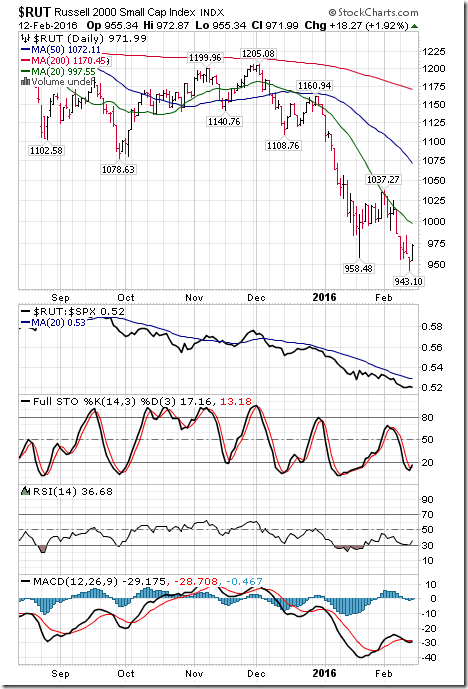
The Russell 2000 Index lost another 13.63 points (1.38%) last week. Intermediate downtrend was extended on a move below 958.48. Strength relative to the S&P 500 Index remains negative. The Index remains below its 20 day moving average. Short term momentum indicators are trending down, but are oversold and showing early signs of bottoming. Technical score remained last week at -6.
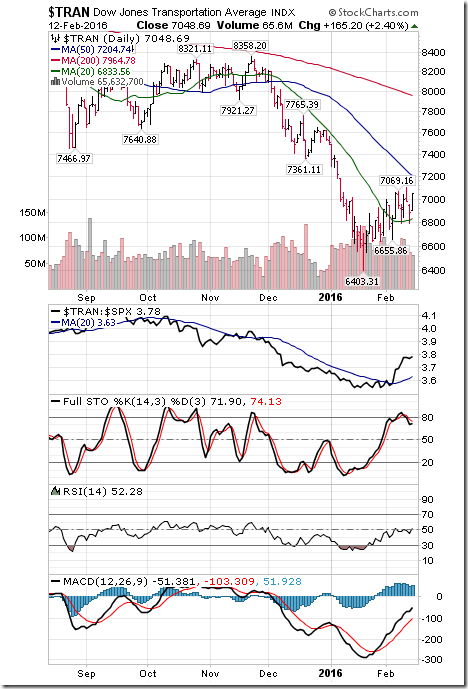
The Dow Jones Transportation Average added 105.99 points (1.53%) last week. Intermediate trend remains down. Strength relative to the S&P 500 Index remains positive. The Average remains above its 20 day moving average. Short term momentum indicators are trending up. Technical score last week remained at 2.
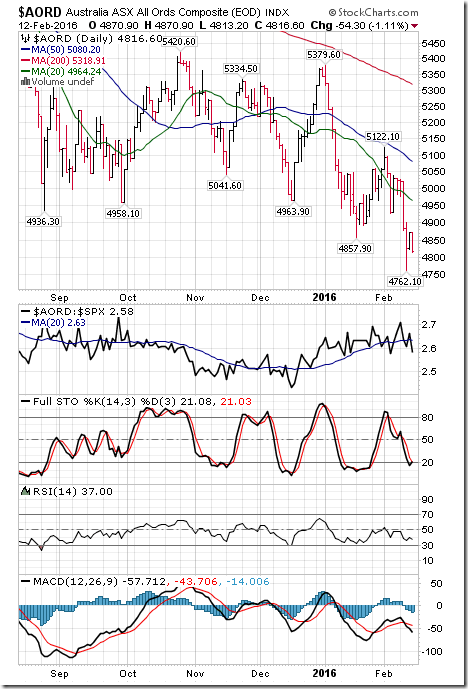
The Australia All Ordinaries Composite Index dropped 209.00 points (4.16%) last week. Intermediate downtrend was extended on a move below 4,857.90. Strength relative to the S&P 500 Index changed to Neutral from Positive. The Index fell below its 20 day moving average last week. Short term momentum indicators are trending down. Technical score dropped last week to -4 from 0.
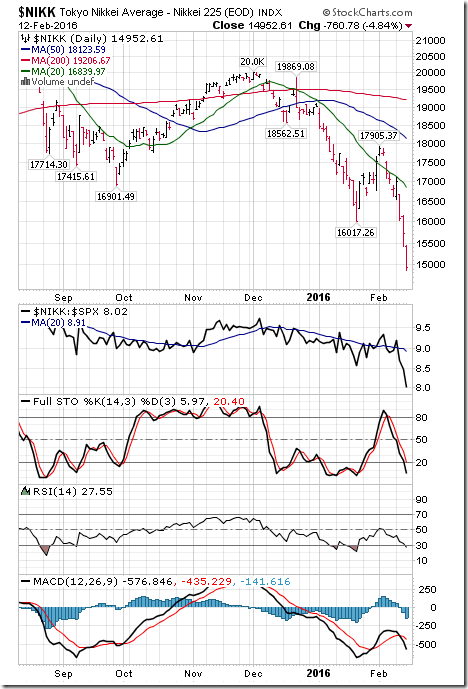
The Nikkei Average plunged 1,866.98 points (11.10%) last week. Intermediate downtrend was extended on a move below 16,017.26. Strength relative to the S&P 500 Index changed to Negative from Neutral. The Average remains below its 20 day moving average. Short term momentum indicators are trending down and are oversold. Technical score dropped to -6 from -4.
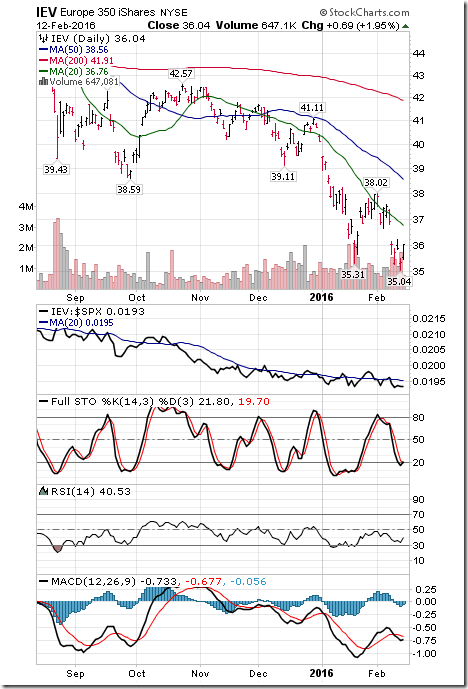
Europe iShares dropped $0.84 (2.33%) last week. Intermediate downtrend was extended on a move below $35.31. Strength relative to the S&P 500 Index remained Neutral. Units remain below their 20 day moving average. Shor term momentum indicators are trending down, but are oversold and showing early signs of bottoming. Technical score last week remained at –4
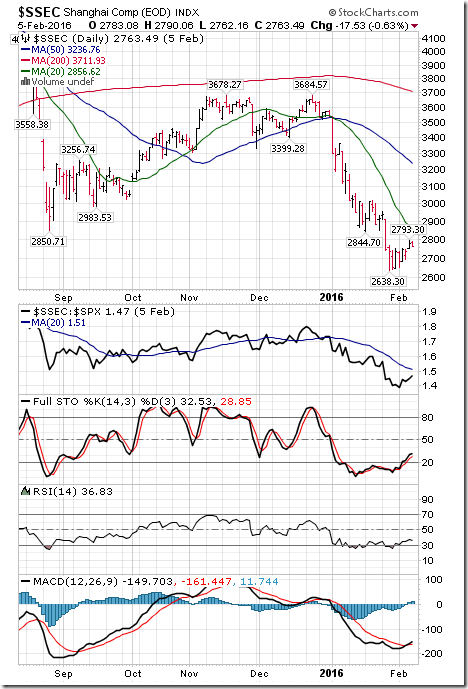
The Shanghai Composite Index was unchanged last week due to the Chinese New Year holiday. Technical score remained at -4.
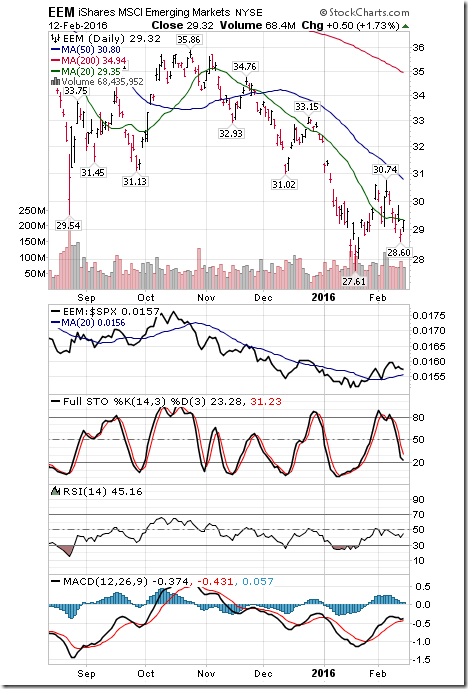
Emerging Markets iShares dropped $0.69 (2.30%) last week. Intermediate trend remains down. Strength relative to the S&P 500 Index changed last week remained positive. Units dropped below their 20 day moving average. Short term momentum indicators are trending down. Technical score dropped last week to -2 from 2
Currencies
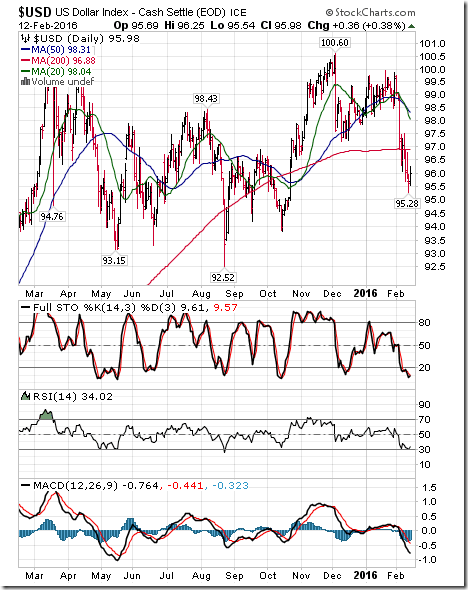
The U.S. Dollar Index dropped another 1.03 (1.06%) last week. Intermediate trend remains down. The Index remains below its 20 day moving average. Short term momentum indicators are trending down and are deeply oversold, but have yet to show signs of bottoming.
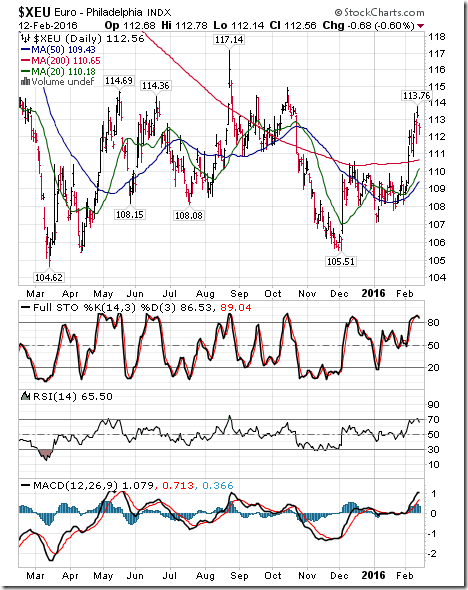
The Euro gained another 0.91 (0.82%) last week. Intermediate trend remains up. The Euro remains above its 20 day moving average. Short term momentum indicators are trending up and are overbought, but have yet to show signs of peaking.
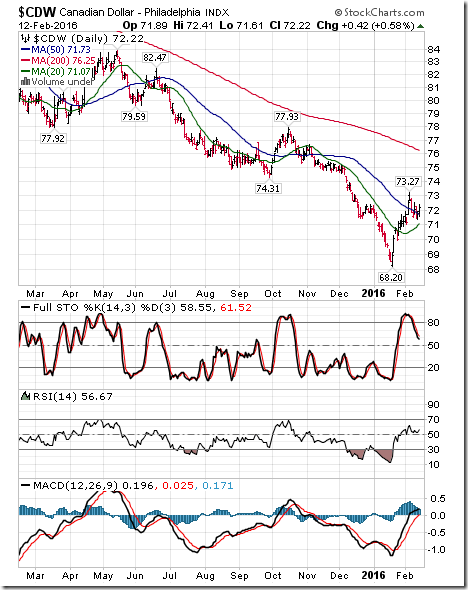
The Canadian Dollar added another US 0.29 cents (0.40%) last week. Intermediate trend remains down. The Euro remains above its 20 day moving average. Short term momentum indicators have rolled over from overbought levels.
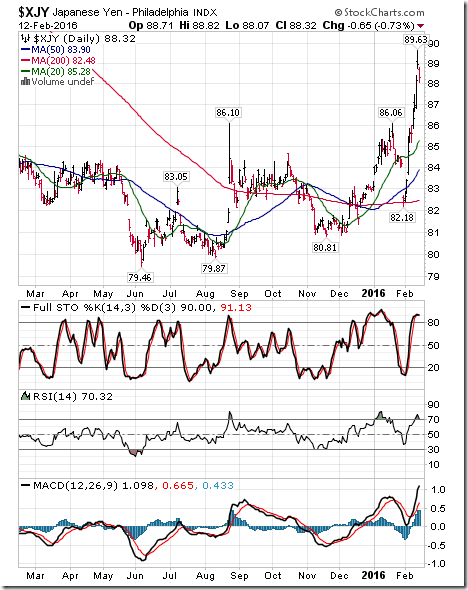
The Japanese Yen gained another 2.82 (3.30%) last week. Intermediate trend remains up. The Yen remains above its 20 day moving average. Short term momentum indicators are trending up and are overbought, but have yet to show signs of peaking.
Commodities
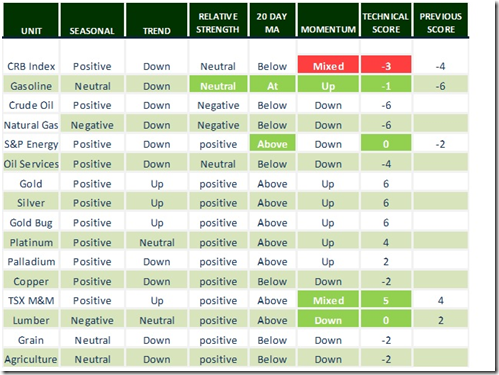
Daily Seasonal/Technical Commodities Trends for February 12th 2016
Green: Increase from previous day
Red: Decrease from previous day
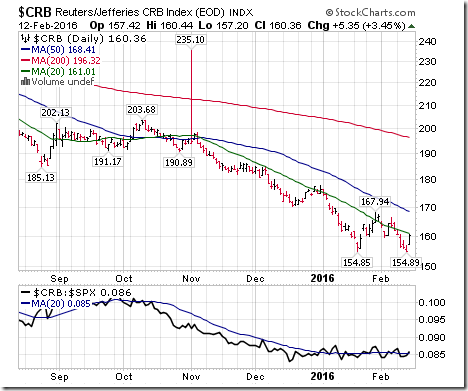
The CRB Index dropped 1.57 points (0.97%) last week. Intermediate trend remains down. Strength relative to the S&P 500 Index remains neutral. The Index remains below its 20 day moving average. Short term momentum indicators changed on Friday to Mixed. Technical score improved last week to -3 from -4.
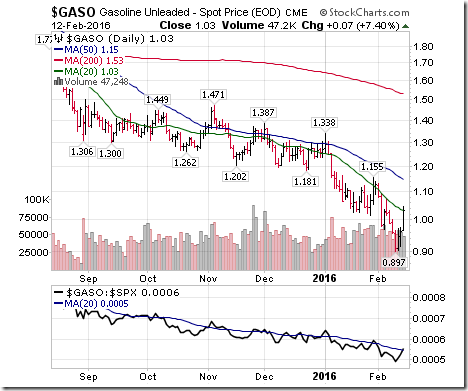
Gasoline added $0.04 per gallon (4.04%) last week including a 7.40% gain on Friday. Intermediate trend remains down. Strength relative to the S&P 500 Index changed on Friday to Neutral from Negative. Gas closed on Friday at its 20 day moving average. Short term momentum indicators changed on Friday to Up from Down. Technical score improved last week to -1 to -6.
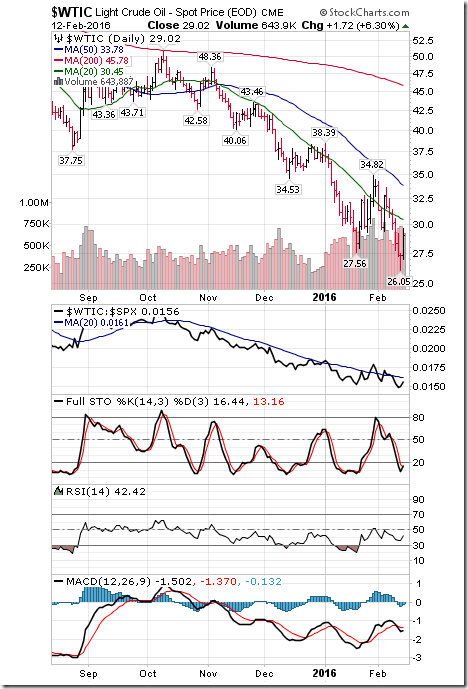
Crude Oil dropped $1.87 per barrel (6.05%) last week despite a gain of 6.30% on Friday. Intermediate trend remains down. Strength relative to the S&P 500 Index remains Negative. Crude remained below its 20 day moving average. Short term momentum indicators are trending down, but are oversold and showing early signs of bottoming. Technical score dropped last week to -6 from -3.
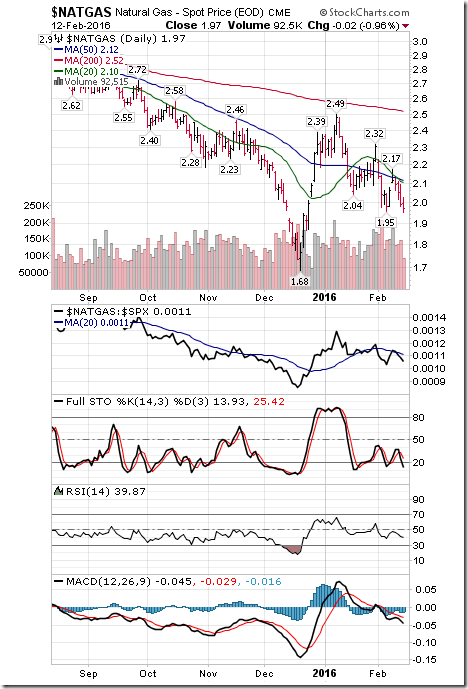
Natural Gas dropped $0.09 per MBtu (6.05%) last week. Intermediate trend remains down. Strength relative to the S&P 500 Index remains negative. “Natty” remains below its 20 day moving average. Short term momentum indicators are trending down. Technical score remains at -6.
The S&P Energy Index dropped 3.41 points (0.81%) last week. Intermediate trend remains down. Strength relative to the S&P 500 Index remains positive. The Index recovered back above its 20 day moving average on Friday. Short term momentum indicators are trending down. Technical score slipped last week to 0 from 2.
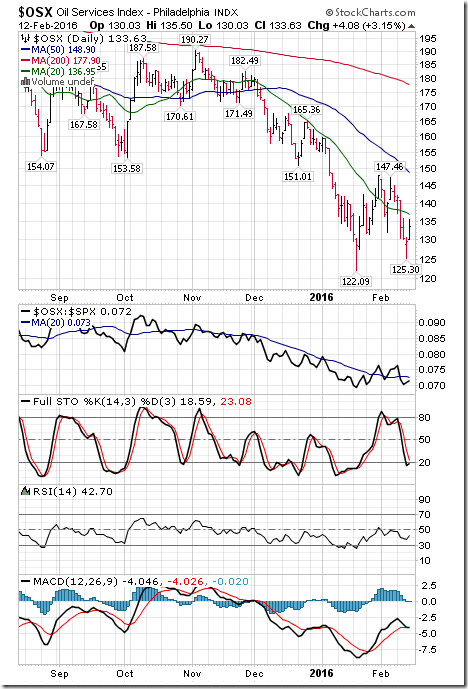
The Philadelphia Oil Services Index dropped 8.17 points (5.76%) last week despite a gain of 3.15% on Friday. Intermediate trend remains down. Strength relative to the S&P 500 Index changed last week to Neutral from Positive. The Index fell below its 20 day moving average last week. Short term momentum indicators are trending down, but are oversold and showing early signs of bottoming. Technical score last week dropped to -4 from 1.
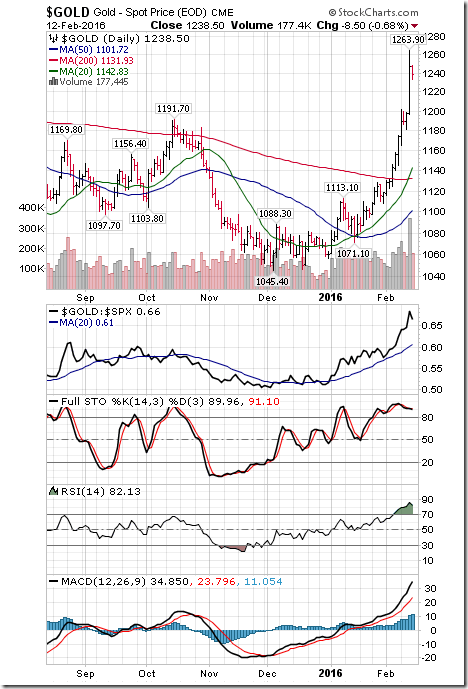
Gold jumped $80.80 per ounce (6.98%) last week. Intermediate trend remains up. Strength relative to the S&P 500 Index remains positive. Gold remains above its 20 day moving average. Short term momentum indicators are trending up and are overbought, but have yet to show signs of peaking.
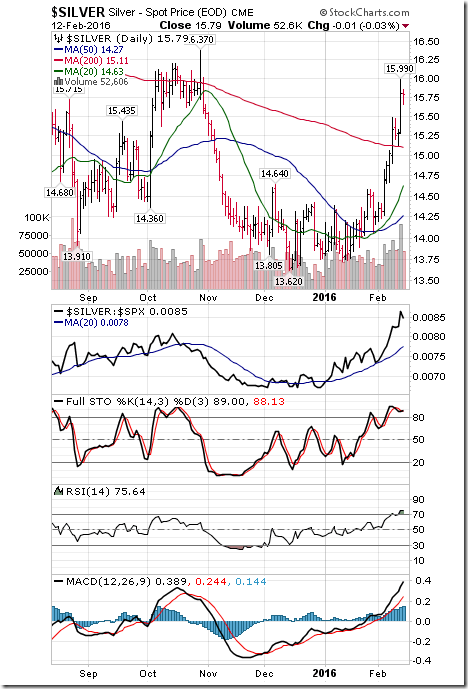
Silver jumped $1.01 per ounce (6.83%) last week. Intermediate trend remains up. Strength relative to the S&P 500 Index remains positive. Silver remains above its 20 day moving average. Short term momentum indicators are trending up and are overbought, but have yet to show signs of peaking Technical score remains at 6. Strength relative to Gold remains Neutral.
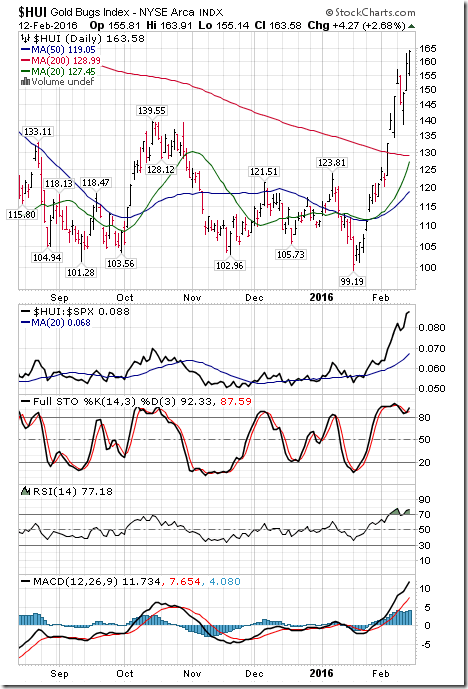
The AMEX Gold Bug Index jumped another 15.74 points (10.65%) last week. Intermediate trend remains up. Strength relative to the S&P 500 Index remains Positive. The Index remains above its 20 day moving average. Short term momentum indicators are trending up and are overbought, but have yet to show signs of peaking. Technical score remained at 6.
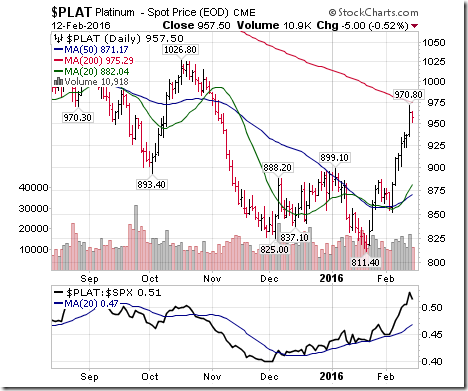
Platinum gained $53.80 per ounce (5.95%) last week. Intermediate trend remains Neutral. Relative strength remains positive. Trades above its 20 day MA. Momentum: Uptrend.
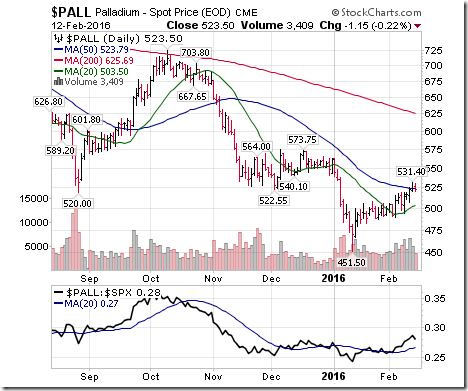
Palladium added $24.80 per ounce (4.97%) last week. Intermediate trend remains down. Strength relative to the S&P 500 Index remains Positive. PALL remains above its 20 day moving average. Short term momentum indicators are trending up. Technical score remained at 2.
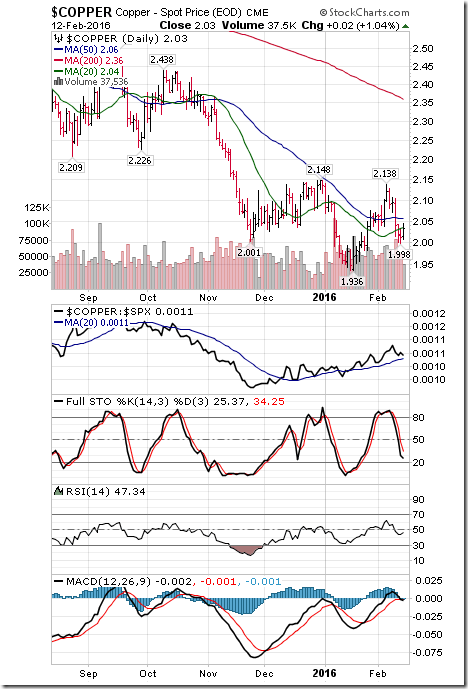
Copper dropped $0.07 per lb. (3.33%) last week. Intermediate trend remains down. Strength relative to the S&P 500 Index remains Positive. Copper slipped below its 20 day moving average last week. Short term momentum indicators are trending down. Technical score slipped last week to -2 from 2.
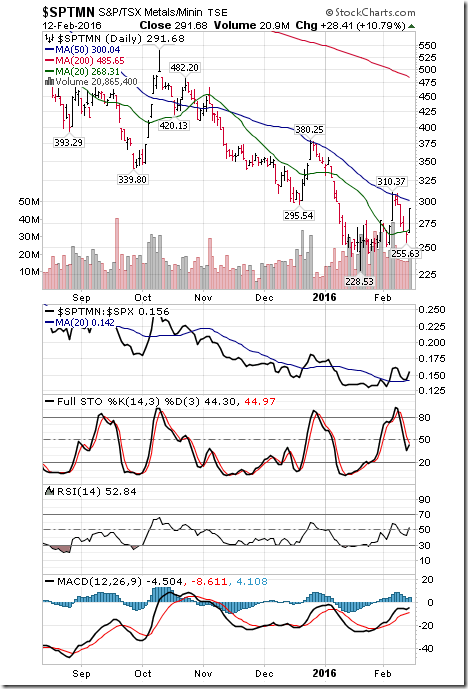
The TSX Metals & Mining Index dropped 14.16 points (4.63%) last week despite a gain of 10.79% on Friday. Intermediate trend remains up. Strength relative to the S&P 500 Index remains Positive. The Index remains above its 20 day moving average. Short term momentum indicators improved on Friday to Mixed. Technical score slipped last week to 5 from 6.
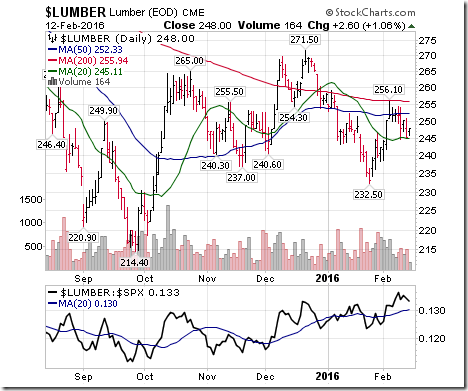
Lumber dropped $4.80 (1.90%) last week. Intermediate trend remains Neutral. Relative strength remains Positive. Lumber remains below its 20 day MA. Short term momentum: Down.
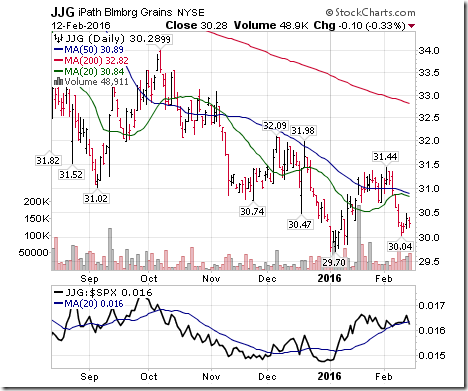
The Grain ETN dropped $0.33 (1.00%) last week. Intermediate trend remains down. Strength relative to the S&P 500 Index remains Positive. Units remain below their 20 day moving average. Short term momentum indicators are trending down. Technical score: -2.
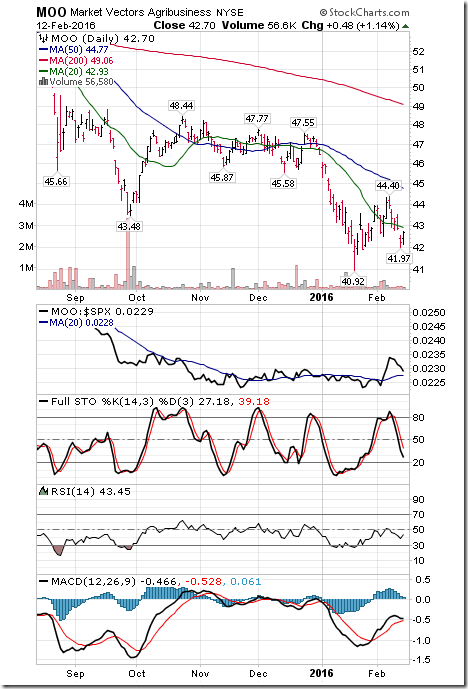
The Agriculture ETF dropped $1.27 (2.89%) last week. Intermediate trend remains down. Strength relative to the S&P 500 Index remains Positive. Units fell below their 20 day moving average last week. Short term momentum indicators are trending down. Technical score dropped to -2 from 2.
Interest Rates
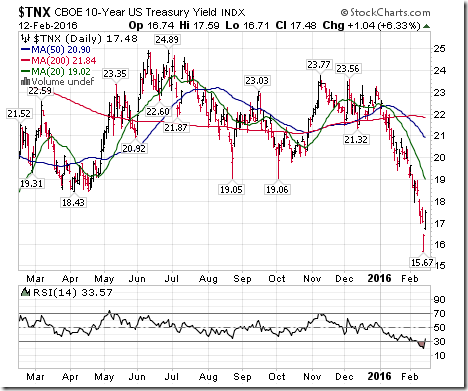
Yield on 10 year Treasuries dropped another 10 basis points (5.41%) last week. Intermediate trend remains down. Yield remains below its 20 day moving average. Short term momentum indicators are trending down and are oversold, but show early signs of bottoming.
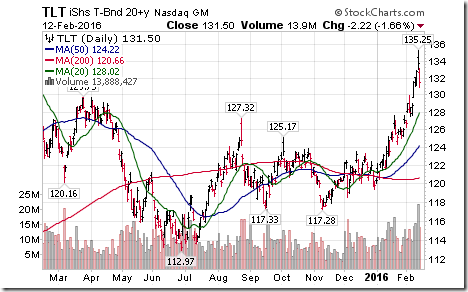
Conversely, price of the long term Treasury ETF gained $2.78 (2.16%) last week. Intermediate trend remains up. Price remains above its 20 day moving average.
Other Issues
U.S. and Canadian equity markets are closed on Monday for holidays.
Early equity market trends this week will be set by overnight responses to the Chinese equity market when trading after the Chinese New Year holiday resumes on Sunday evening and Monday evening.
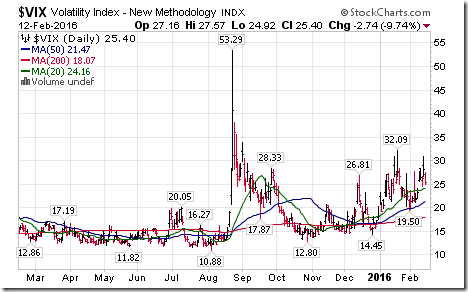
The VIX dropped 3.00 (8.55%) last week after reaching a high of 30.90 on Thursday. Intermediate trend remains up. The Index remains above its 20 day moving average. The VIX Index reached an intermediate high at 32.09% on January 21st .
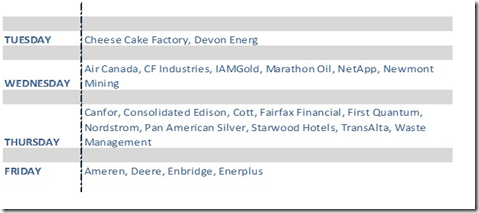
Fourth quarter reports by S&P 500 companies are winding down and fourth quarter reports by TSX 60 companies are winding up this week. 56 S&P 500 companies and one Dow Jones Industrial Average company are scheduled to release quarterly results this week. According to FactSet 76% of S&P 500 companies have reported quarterly results to date: 69% reported higher than consensus earnings and 49% reported higher than consensus sales. On a blended basis fourth quarter earnings on a year-over-year basis declined 3.7% and sales dropped 3.5%.
S&P 500 estimates for 2016 continue to decline: 68 companies have issued negative first quarter guidance and 17 companies have issued positive guidance. Year-over-year earnings are expected to fall 6.0% in the first quarter, but improve to a fall of 0.7% in the second quarter, 5.3% in the third quarter and 10.4% in the fourth quarter.
Economic news this week is expected to be mixed. A focus is on January Industrial Production to be released on Wednesday. A strong recovery could set the stage for another boost in North American equity markets.
Technical action by S&P 500 stocks was decidedly bearish last week: 102 stocks broke intermediate support levels. Only 12 broke resistance. However, virtually all of the breakouts occurred on Friday implying a change in sentiment on the charts. Look for the change in sentiment to continue this week.
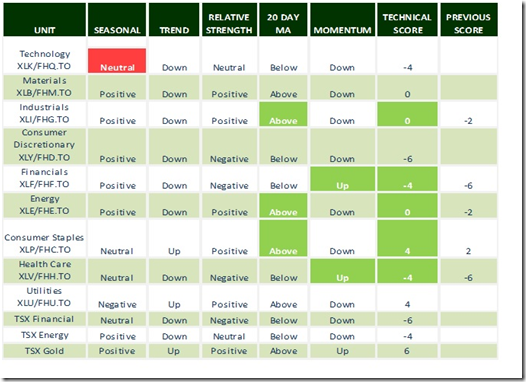
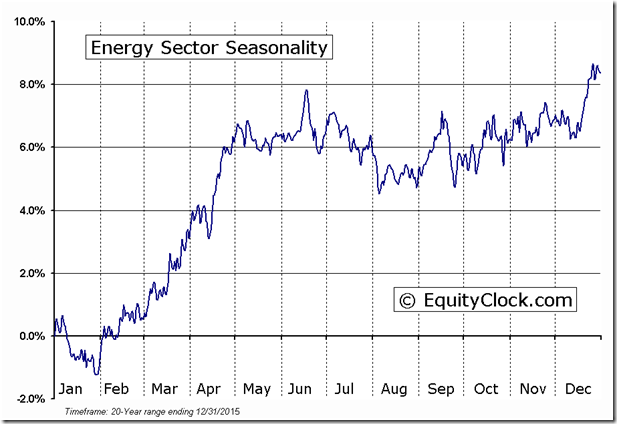
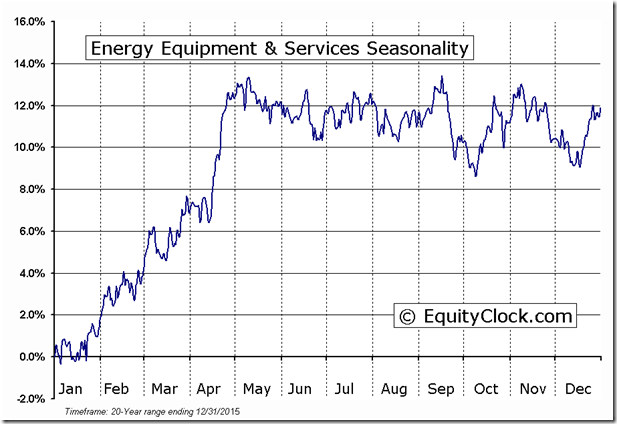
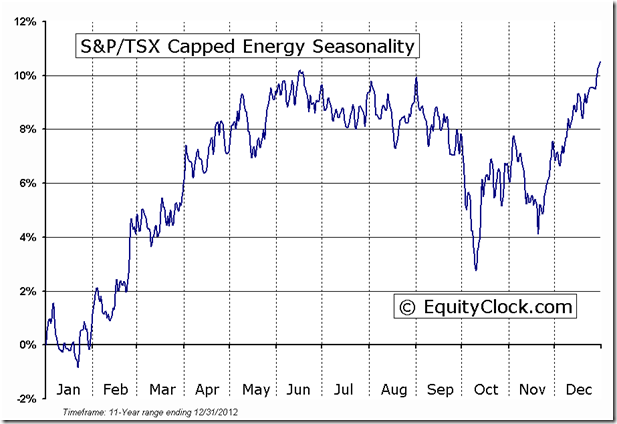
Favourable seasonal influences for Industrials, Materials and Energy have appeared. These sectors currently are outperforming the market at the beginning of their spring period of seasonal strength.
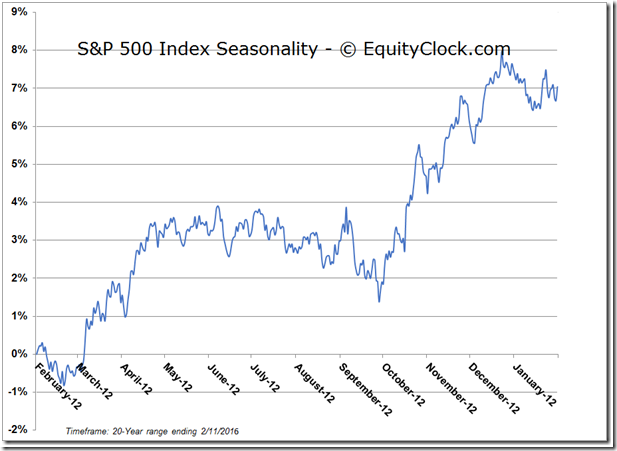
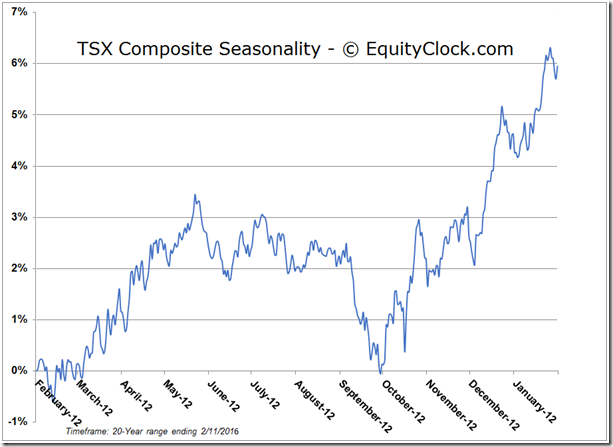
Seasonal influences on North American equity markets are mixed to the end of February followed by a strong gain through to May.
Sectors
Daily Seasonal/Technical Sector Trends for February 12th 2016
Green: Increase from previous day
Red Decrease from previous day
Special Free Services available through www.equityclock.com
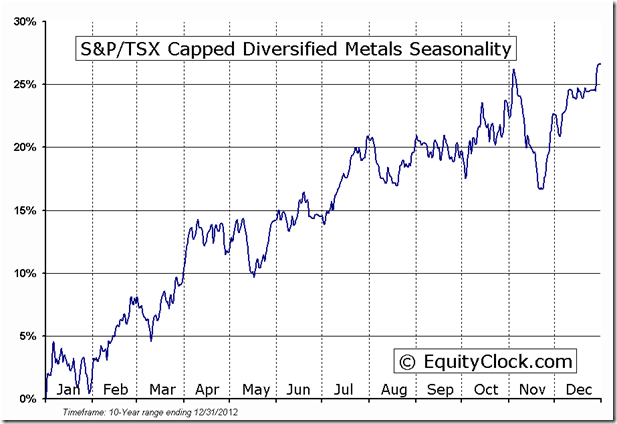
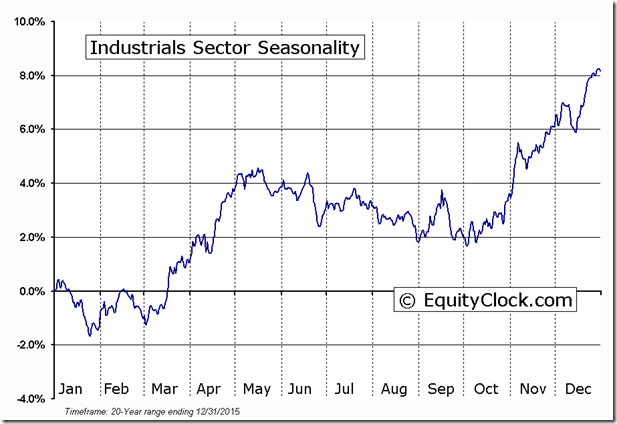
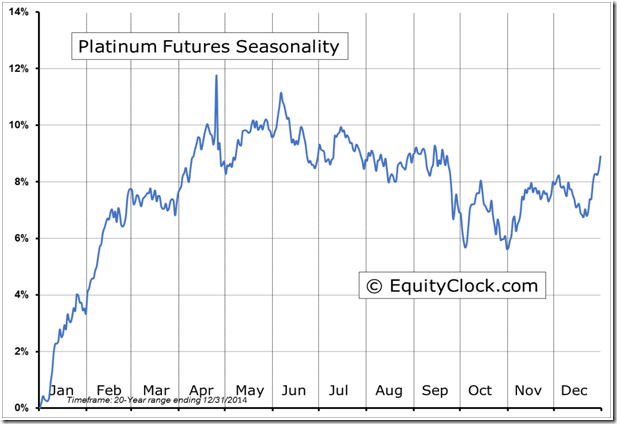
Equityclock.com is offering free access to a data base showing seasonal studies on individual stocks and sectors. The data base holds seasonality studies on over 1000 big and moderate cap securities and indices. To login, simply go to http://www.equityclock.com/charts/ Following are examples:
Editor’s Note: Strength relative to the S&P 500 Index already has turned positive for U.S. Energy, U.S. Oil Services and Canadian Energy stocks
Notes developed prior to the BNN appearance on Friday
Market Outlook
North American equity markets reached an intermediate low on January 21st at the end of a volatility spike. Seasonal influences for North American equity markets are scheduled to turn positive at the end of February following release of difficult fourth quarter results. North American industrial production is receiving an extra boost early this year thanks to warmer than average “El Nino driven” weather. First quarter earnings and revenues on a year-over-year basis will be surprisingly strong relative to the first quarter last year when the coldest weather in over a decade was recorded. Earnings gains by major U.S. and Canadian companies are expected to accelerate as the year progresses. By the fourth quarter, consensus for S&P 500 companies is an earnings gain of 10.5% on a year-over-year basis.
Top Picks
BMO Equally Weighted Metals and Mining ETF (ZMT on the TSX)
Seasonal influences turned positive in the third week of January and remain positive until mid-April. On the charts, units reached an intermediate bottom on January 21st, moved above their 20 day moving average and currently are showing strength relative to the S&P 500 Index and TSX Composite Index. The sector will benefit from improving metal prices thanks partially to weakness in the U.S. Dollar Index. Precious metal prices bottomed in December and base metal prices bottomed in mid-January. A word of caution: Fourth quarter results released during the next 2-3 weeks will be brutal. Preferred strategy is to buy on weakness.
First Trust U.S. Industrial Sector ETF (FHG on the TSX)
Seasonal influences turned positive in the third week in January and remain positive until mid-May. Bonus this spring is the El Nino effect when warmer than average weather is boosting Industrial Production. On the charts, units reached an intermediate low on January 21st, moved above their 20 day moving average and currently are showing strength relative to the S&P 500 Index. Earnings prospects are improving thanks to lower energy costs (a large part of the Industrial sector are transportation stocks that are benefitting from lower fuel costs).
ETFX Physical Platinum ETN (PPLT on the NYSE)
Seasonal influences turned positive in mid-December and remain positive until late April. This year, Platinum bottomed in mid-January, moved above its 20 day moving average and currently shows strength relative to the S&P 500 Index. Demand of Platinum continues to improve thanks to strong demand for the metal used in catalytic converters by the auto industry.
Seasonality charts for top picks
Disclaimer: Seasonality and technical ratings offered in this report by www.timingthemarket.ca and www.equityclock.com are for information only. They should not be considered as advice to purchase or to sell mentioned securities. Data offered in this report is believed to be accurate, but is not guaranteed
Copyright © DV Tech Talk, Timingthemarket.ca


